
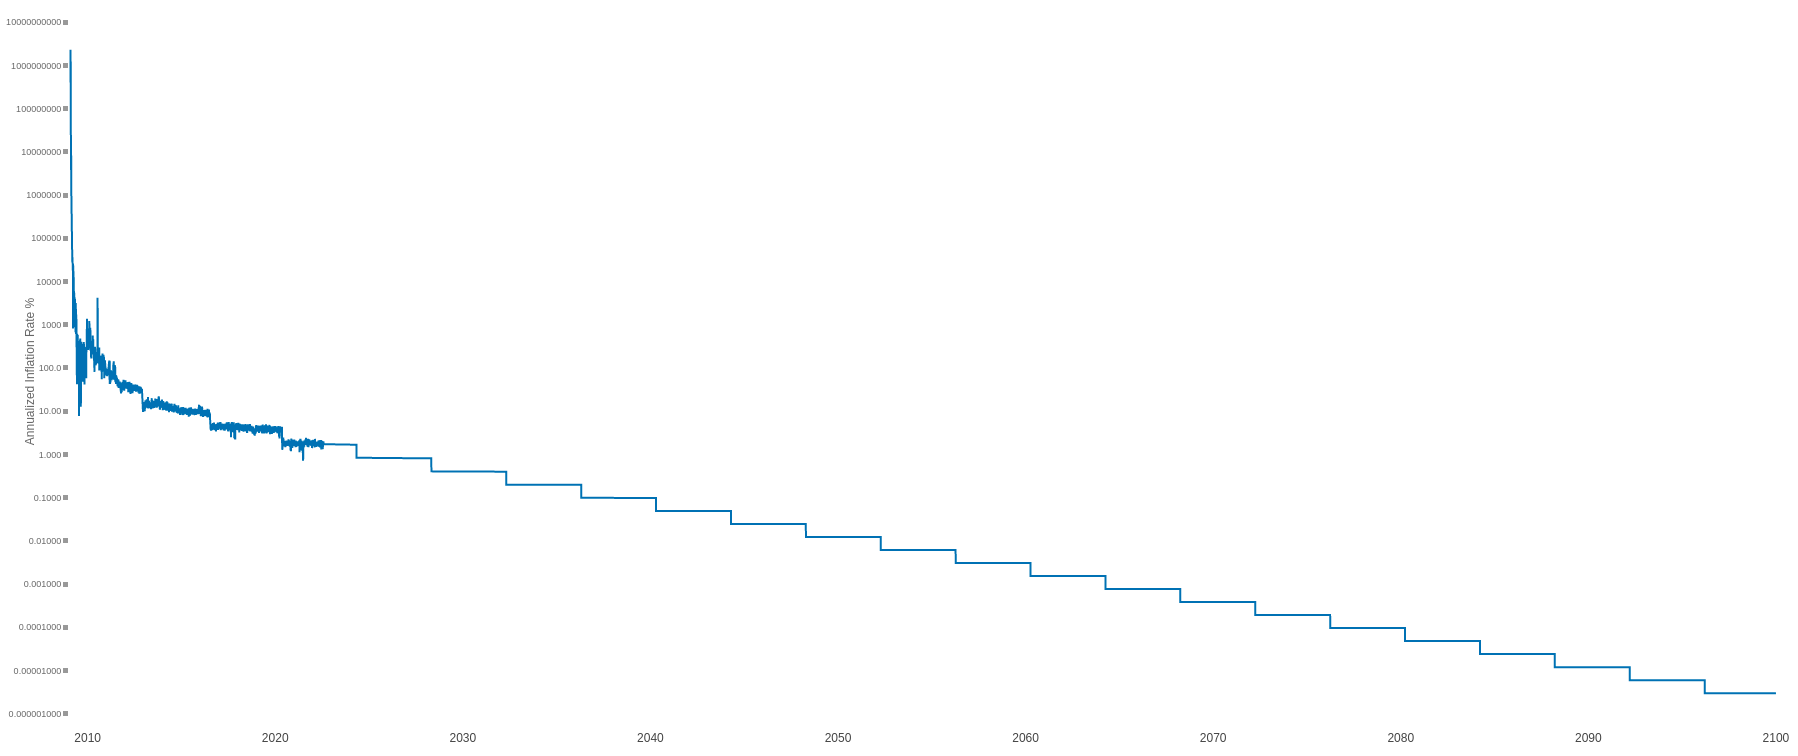
Announcing the overhaul of my 2022 project, The goal of the site is to show a variety of perspectives of how inflation has affected the value of things, and a reminder that the inflation adjusted value is a lot lower than its exchange rate. Suggestions welcome for other charts to add!
Replies (4)

Default avatar
Foo 1 week ago
I think it was River who had a bunch graphs of all fiat currencies devaluing over time, maybe add those so that it’s not just the US dollar
Chart suggestion: median home price and a year of college tuition priced in hours of median wage work, then in sats. Hours of labor is the comparison that clicks for people who've never thought about inflation.
Two charts would earn their place. First: bitcoin priced in barrels of crude, since energy sits under every other price and the data comes free from the EIA. Second: your dollar-adjusted series repeated for a few high-inflation currencies, because 'bitcoin is up' and 'the lira is down' are the same sentence read from opposite ends. On the goods chart, median wage would serve better than average. The average is dragged up by the top decile and quietly shortens the bar for the typical worker. I also like that the M2 and CPI series disagree. That gap is the honest part, because the answer depends on which ruler you pick.
↑