1/ In this thread 🧵 I want to show you some good on chain #Bitcoin indicators to know where the price is at the cycle.
I’ll do in the order the indicator was triggered.
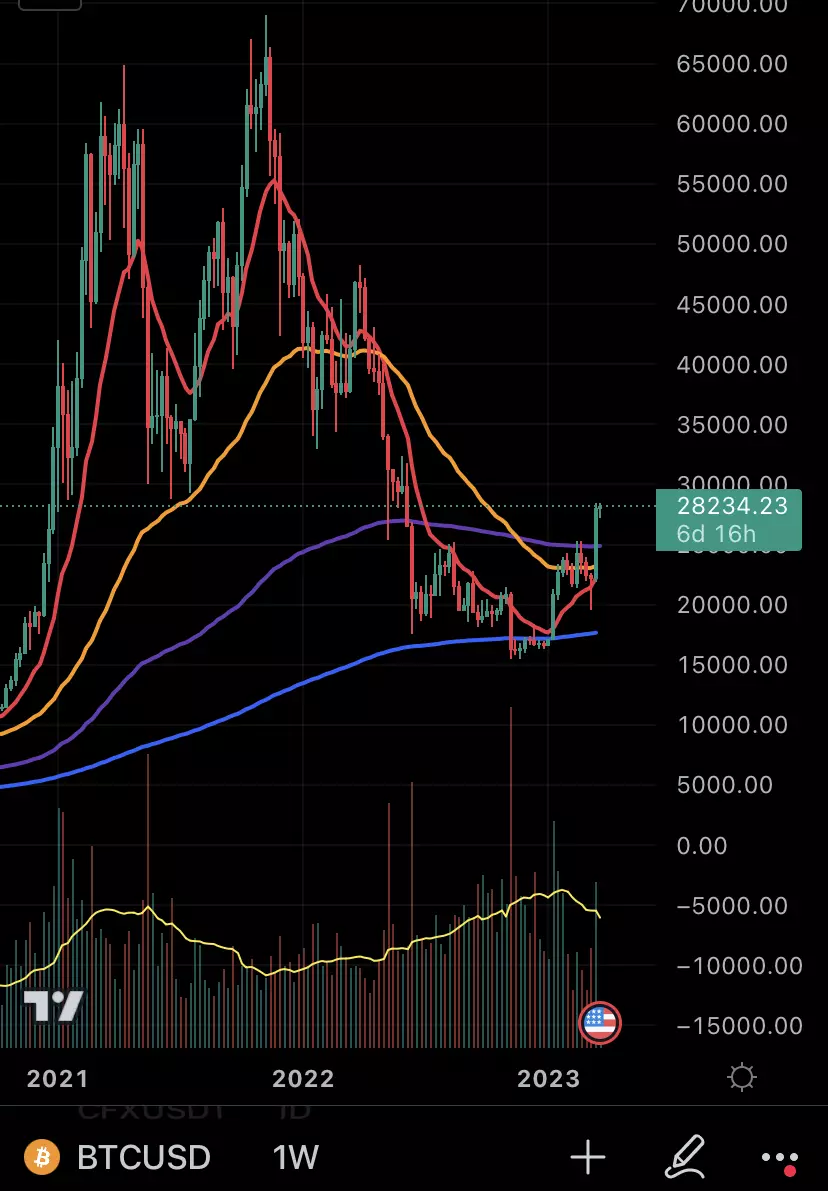
Remember 11-09-22 Bitcoin bottom was $15,682 (I think it’s this cycle bottom, I hope so)
Login to reply
Replies (12)
2/ SOPR (SPENT OUTPUT PROFIT RATIO): it is the ratio between the value of the UTXO when created and when the UTXO is spent.
Greater than 1 -> Bullish
Lower than 1 -> Bearish
On 01-11-23 this indicator is triggered. Chart shows a changing trend from less than 1 to more than 1.
I use 14D moving average. For more noise try 7D

Glassnode Studio - Digital Asset Analytics
Glassnode Studio delivers trusted digital assets analytics, helping investors and teams analyze market trends, asset activity, and ecosystem dynami...

3/ REALIZED PRICE: it is the value of all bitcoins at the price they were bought divided by the number of bitcoins in circulation.
It shows clearly the long timeframe trend.
On 01-11-23 this indicator is triggered


Bitcoin Magazine Pro
Realized Price | BM Pro
Realized Price Free Bitcoin Live Chart showing Realized Price versus Market Price.

4/ 200D SMOOTHED MOVING AVERAGE
Moving average on daily timeframe
On 01-16-23 this indicator is triggered.
For less noise, try 200W MOVING AVERAGE
Actually triggered this week, BUT wait for the closed week candle to confirm.


Bitcoin Magazine Pro
200 Week Moving Average Heatmap | BM Pro
200 week moving average (WMA) heatmap for Bitcoin investing. Uses a colour heatmap based on the % increases of that 200 week moving average.

5/ GOLDEN CROSS
When EMA25 exceeds EMA100 on daily
On 02-07-23 this indicator is triggered.


6/ DELTA TOP - TERMINAL PRICE
They use to show the top of the cycle. DELTA TOP didn’t touch the price line while TERMINAL PRICE did.


Bitcoin Magazine Pro
Delta Top | BM Pro
Delta Top free live chart identifying Bitcoin cycle tops

Bitcoin Magazine Pro
Terminal Price | BM Pro
Terminal Price free live chart identifying Bitcoin market cycle tops.

7/ BALANCED PRICE - CVDD
They use to show the bottom of the cycle. BALANCED PRICE didn’t touch the price line. CVDD did.
Similar to DELTA PRICE.


Bitcoin Magazine Pro
Balanced Price | BM Pro
Balanced Price free live chart identifying Bitcoin market cycle lows.

Bitcoin Magazine Pro
CVDD | BM Pro
CVDD (coin value days destroyed) free live chart identifying Bitcoin market cycle lows.

8/ MVRV Z-SCORE
It shows overvalued zone (red) and undervalued (green). MVRV more than 3 used to show the top of the cycle.


Bitcoin Magazine Pro
MVRV Z-Score | BM Pro
MVRV Z-Score uses a z-score standard deviation between market value and realised value (MVRV) to identify $BTC market tops and bottoms.

9/ This’s not financial advice, just for educational purpose.
If you liked this thread, please reply, share or even zap⚡
10/ 200W MOVING AVERAGE
When 200 WEEKLY MOVING AVERAGE is crossed by the price that’s bullish
On 03-19-23 this indicator is triggered.


11) RSI MONTHLY
RSI MONTHLY > 50
Lagged indicator, it confirms accumulation time is over. It doesn’t mean bullish short term but long.
On 03-31-23 this indicator is triggered.


View quoted note →
Just zoom out and having a look at those indicators.
It seems that Institutions have not full filled bags yet, so back to acummulation zone instead of keep up trending, maybe till end of 2023 (supposed ETF approval 2024 Q1).
RSI and SOPR don't want to keep trending at the moment.
Max pain Bitcoin Open Interest August 25th at $28.500, so maybe a green candle in few days to reach it (actually $26.000).
Still in range for few months till Institutions are ready to 🚀
Just below 9 #Bitcoin indicators to follow regularly to know at which part of the cycle we are
View quoted note →