Peter du Toit's avatar
Peter du Toit
peterdutoit@peterdutoit.com
npub144ed...urkq
I speak about climate futures, mitigation and adaptation in the face of the climate crisis. 🇿🇦
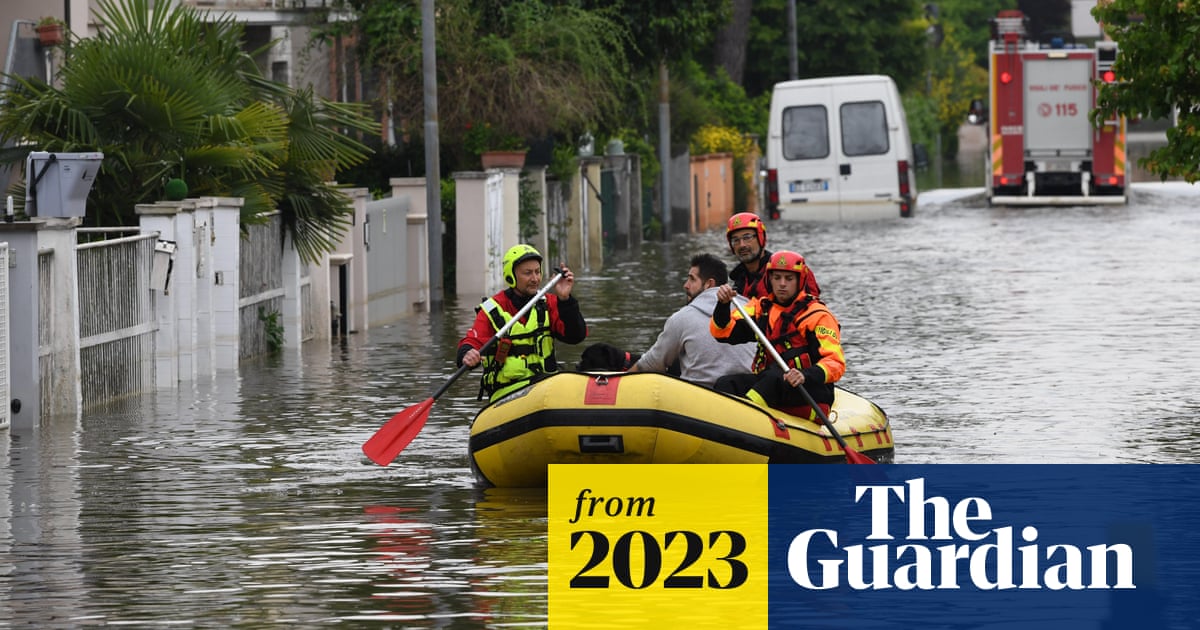
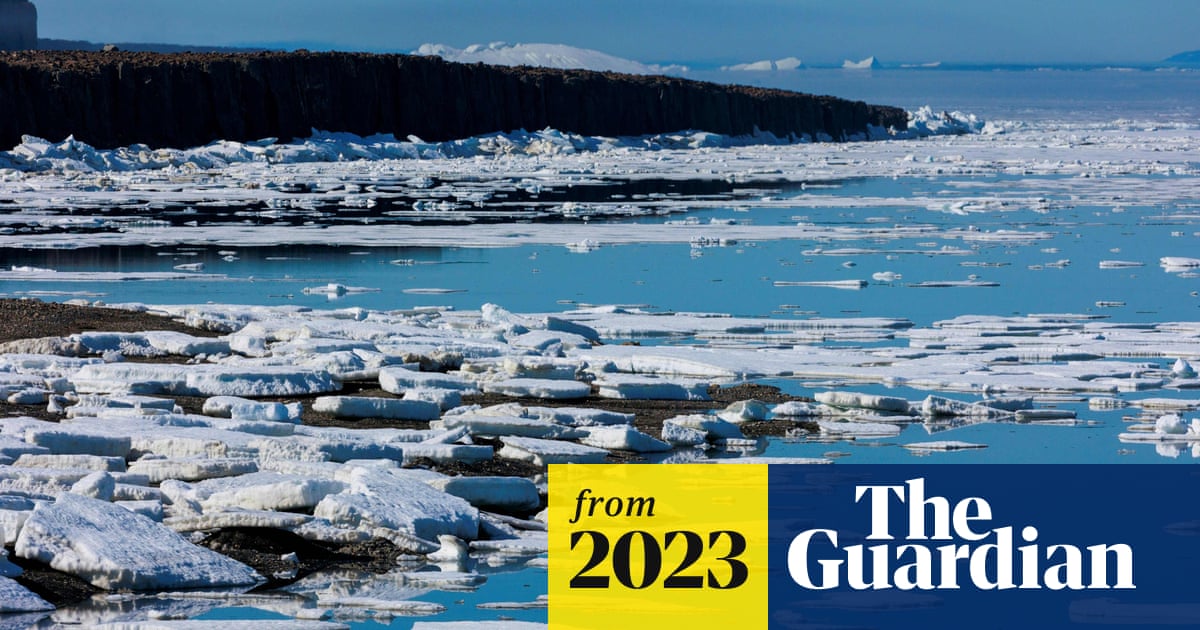
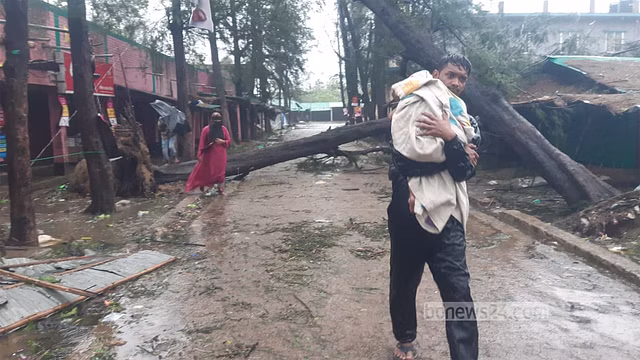
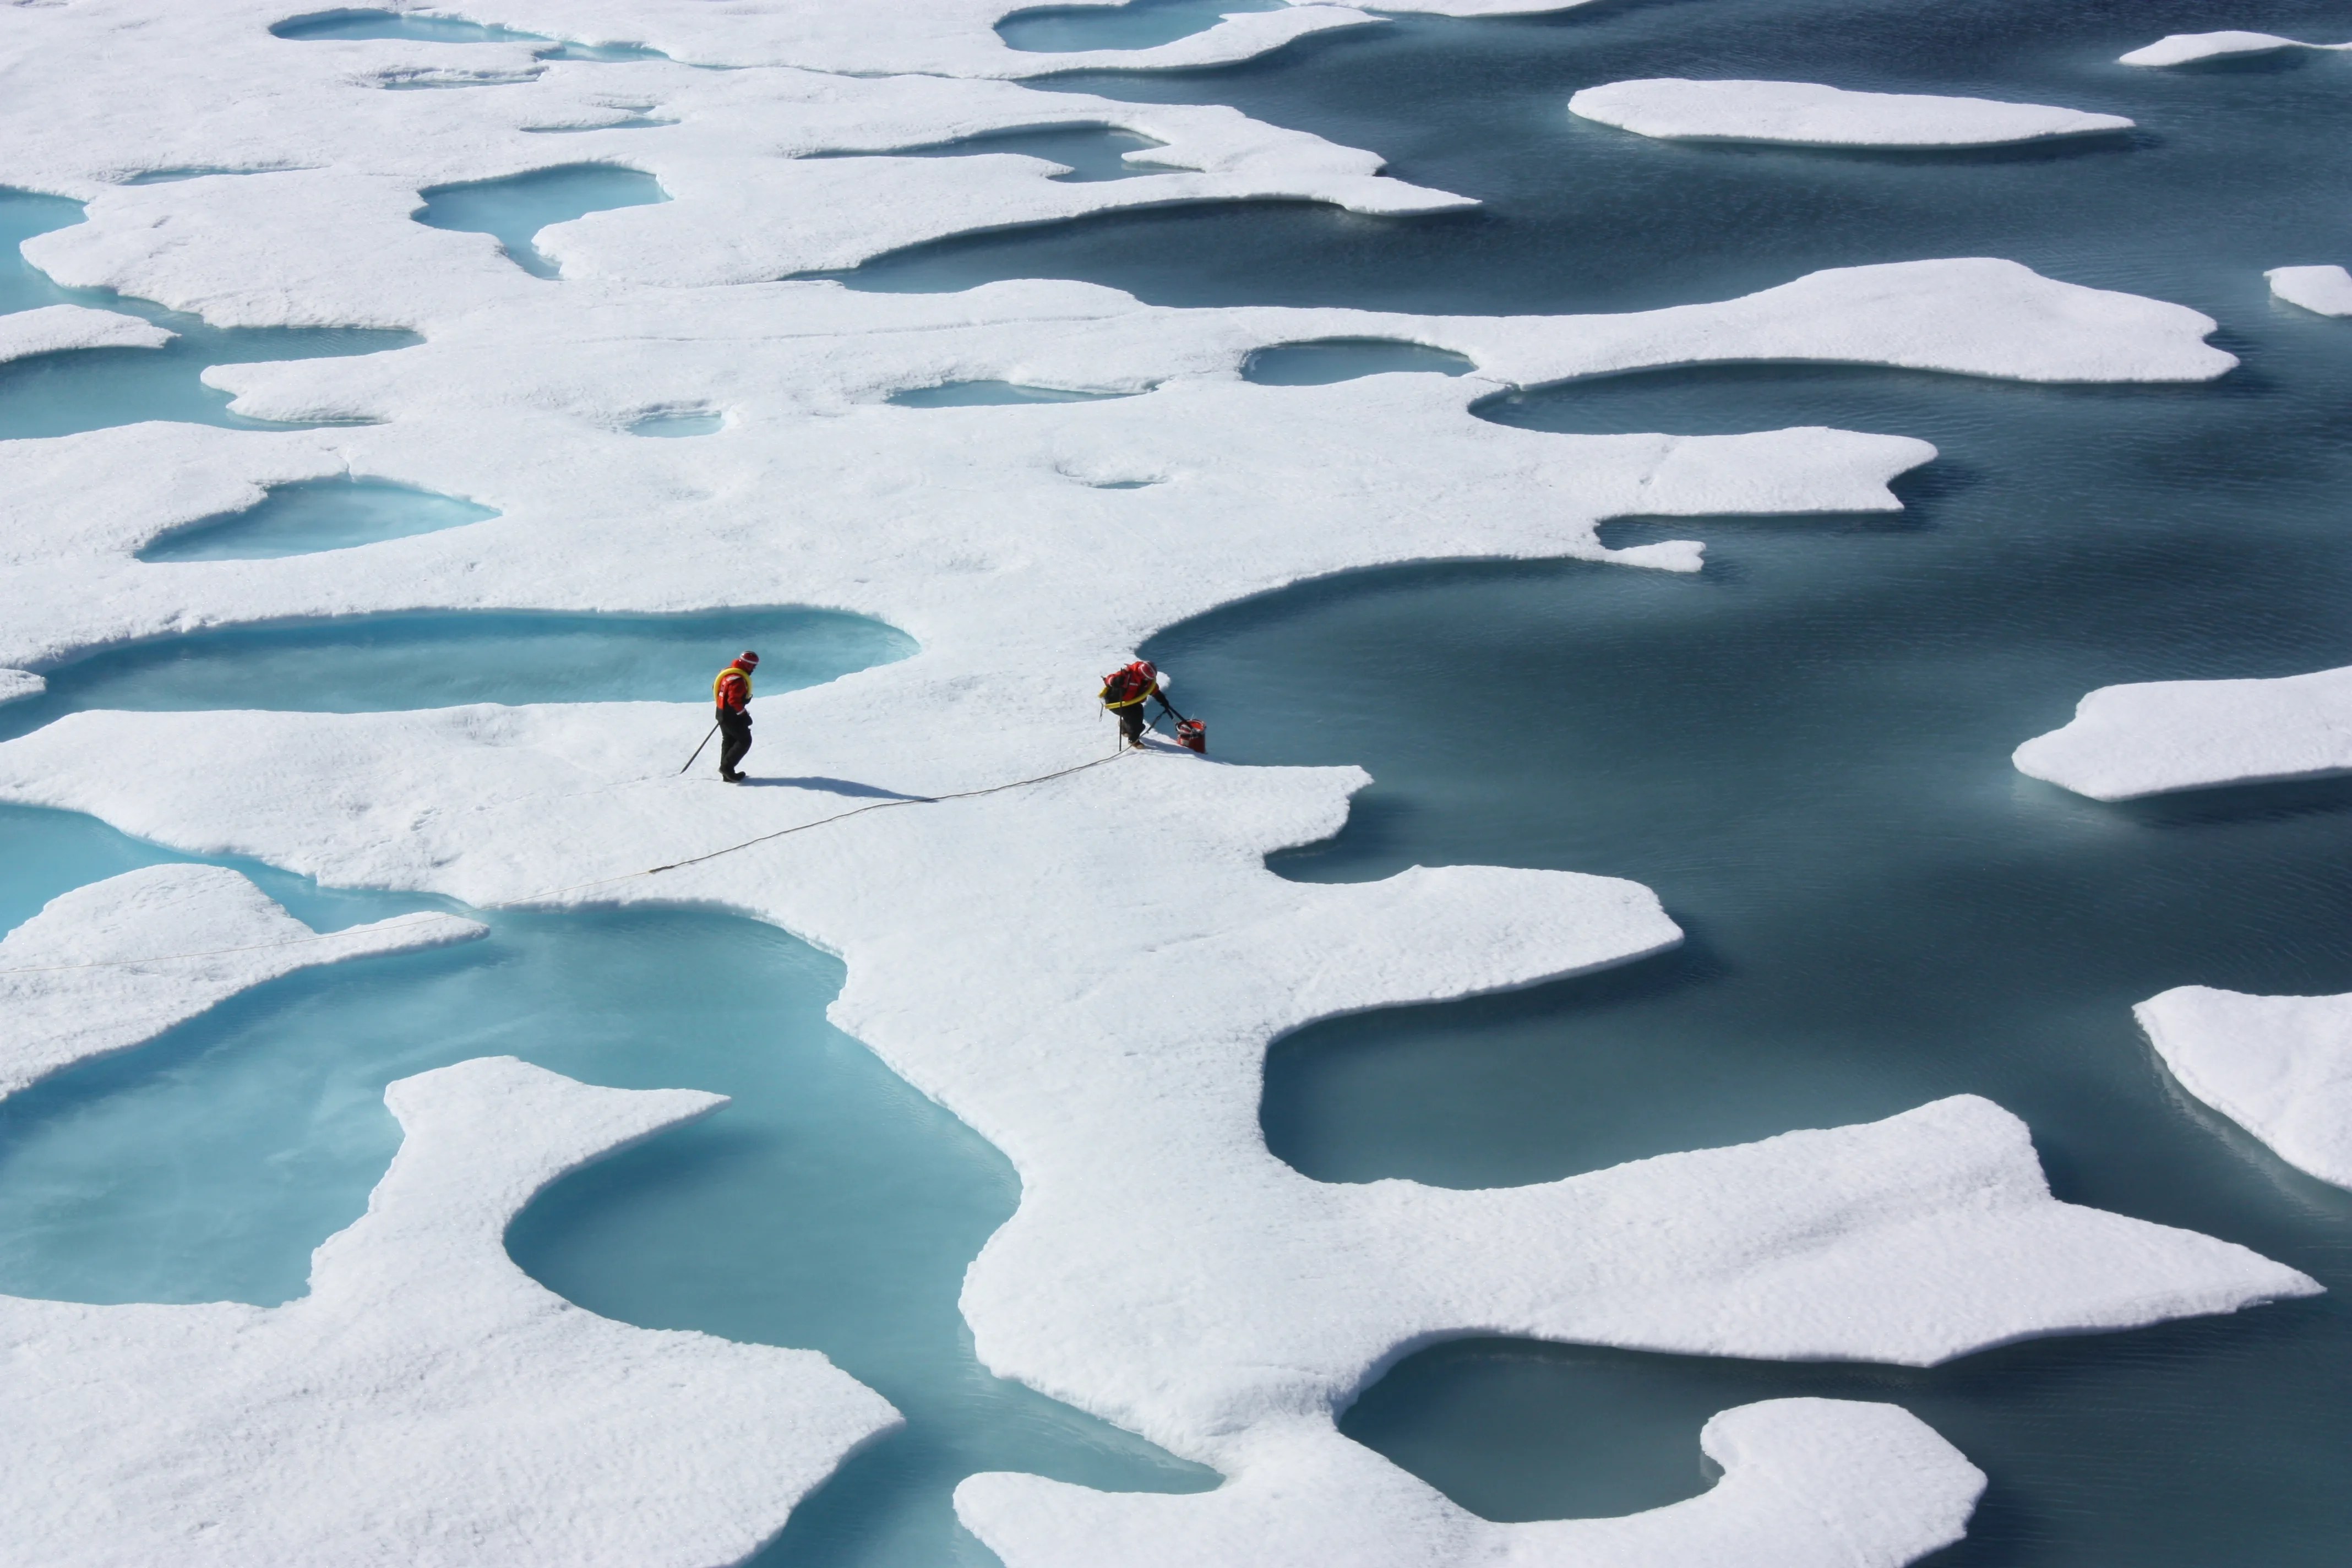
We *have* to talk about adaptation as a result of the warming we are *already* committed to. But we need to understand that we are already brushing up against the limits of adaptation. (See pic) Which is why we also *have* to talk about mitigation because if we don't slam the brakes on emissions our ability to adapt at all will fade into the rearview mirror. Graphic source material: https://www.ipcc.ch/report/ar6/wg2/downloads/report/IPCC_AR6_WGII_SummaryForPolicymakers.pdf #ClimateCrisis #ClimateLiteracy #Adaptation #Mitigation image
Latest risk assessment for our rapidly heating world: At 3.6 - 4.4°C — 4.5 billion people will be “outside of [the] historical climate niche posing an existential risk” to them At 2.7°C — 3 billion people “It exposes almost the entire area of some countries (eg, Burkina Faso, Mali) to unprecedented heat, including some Small Island Developing States (eg. Aruba, Netherlands Antilles)—a group with members already facing an existential risk from sea-level rise.” Source: https://www.nature.com/articles/s41893-023-01132-6#Fig5 #ClimateCrisis
Every country will have its own emissions profile. This is the US. There is SO much we can do RIGHT NOW to change these numbers! For example, let’s look at what we can do to slash transportation emissions: 🚶‍♀️Walk to work if you can 🚲 Cycle to work if you can 🚝 Use public transport 🚙 Use an EV if you can 🏡 Work from home 3 days per week ✈️ Meet/Present online instead of flying May 20th 2023: CO2 423.58 ppm Global temp. +1.27°C #futureofwork #climateliteracy #mitigation #leadership image
Drone footage from the flood stricken north eastern parts of Italy (Lugo) this morning. May 16, 2023 - CO2 atmospheric concentrations: 422.50 ppm - Global average temperature above pre-industrial 1.27ºC #Italy #Lugo
One aspect of #CimateLiteracy is understanding what to expect in the area you live as we continue to heat and then make contingency plans for adaptation. The WMO is advocating for an early warning system and some of the recently launched satellites will go a long way in helping with this system. Right now parts of Asia and India in particular and Canada have been hit by early heatwaves that are putting large numbers of vulnerable people at risk. Our climate models are useful but events are moving faster than we anticipated which requires almost real-time warning systems to be dramatically improved and invested in. https://www.cbc.ca/news/canada/british-columbia/organizations-scramble-heat-wave-seniors-1.6844477
So they have started tracking #CycloneFabien in the South Indian Ocean. General direction #Mauritius. It would be super strange if it reached them as cyclone season ends March/mid-April but who knows in a world where ocean heat records are off the charts. Certainly has sufficient warm water to feed this storm.
Remember this image from the updated study on where the energy goes? Notice that the oceans absorb 89% What does that mean? “Every year about 134 million atomic bombs of heat is being trapped by the ocean. It has kept global temperatures down and kept the land livable but we have to realise that energy hasn’t gone.” image
#CycloneMocha🌀will further intensify until landfall between Cox’s Bazar (Bangladesh) and Kyaukpyu (Myanmar), close to Sittwe (Myanmar) on Sunday 14 May (around noon, local time). 💨 It is forecast to make landfall with sustained maximum winds of 180-190 km/h, 🌊 A storm surge of about 2.0-2.5 m above the astronomical tides is likely to inundate low-lying areas. 🌧️ Heavy rainfall is forecast, with the possible risk of floods, flash floods and landslides. There will be major impacts both ahead and after landfall for potentially hundreds of thousands of the world’s most vulnerable people. Cox’s Bazaar is home to nearly one million Rohingya refugees - the world’s largest camp. The state of Rakhine in neighbouring Myanmar has about six million people in need of humanitarian assistance. image
Did you know: To determine atmospheric CO2 concentrations air samples are regularly collected from observatories, tall towers, aircraft, and weather balloons at 86 locations worldwide. (See In addition, NASA’s Orbiting Carbon Observatories, OCO-2 and OCO-3, make around 100,000 measurements around the world each day. These instruments ALL show the rising CO2 concentration trajectory. We can’t say we didn’t know! #ClimateLiteracy #CO2 image
We are having a solid wet start to our Friday with a sub-polar onshore flow creating lots of cloud and rain and our first snow possible Friday night and into Saturday ❄️ image
WMO: For Sunday May 14 +- 0600 UTC "Max sustained wind speed of 140-150 km/h. Storm surge with a height of about 2.0 -2.5 meters above the astronomical tide is likely to inundate low lying areas of North #Myanmar and adjoining Southeast #Bangladesh coasts at the time of landfall." #EarlyWarning image