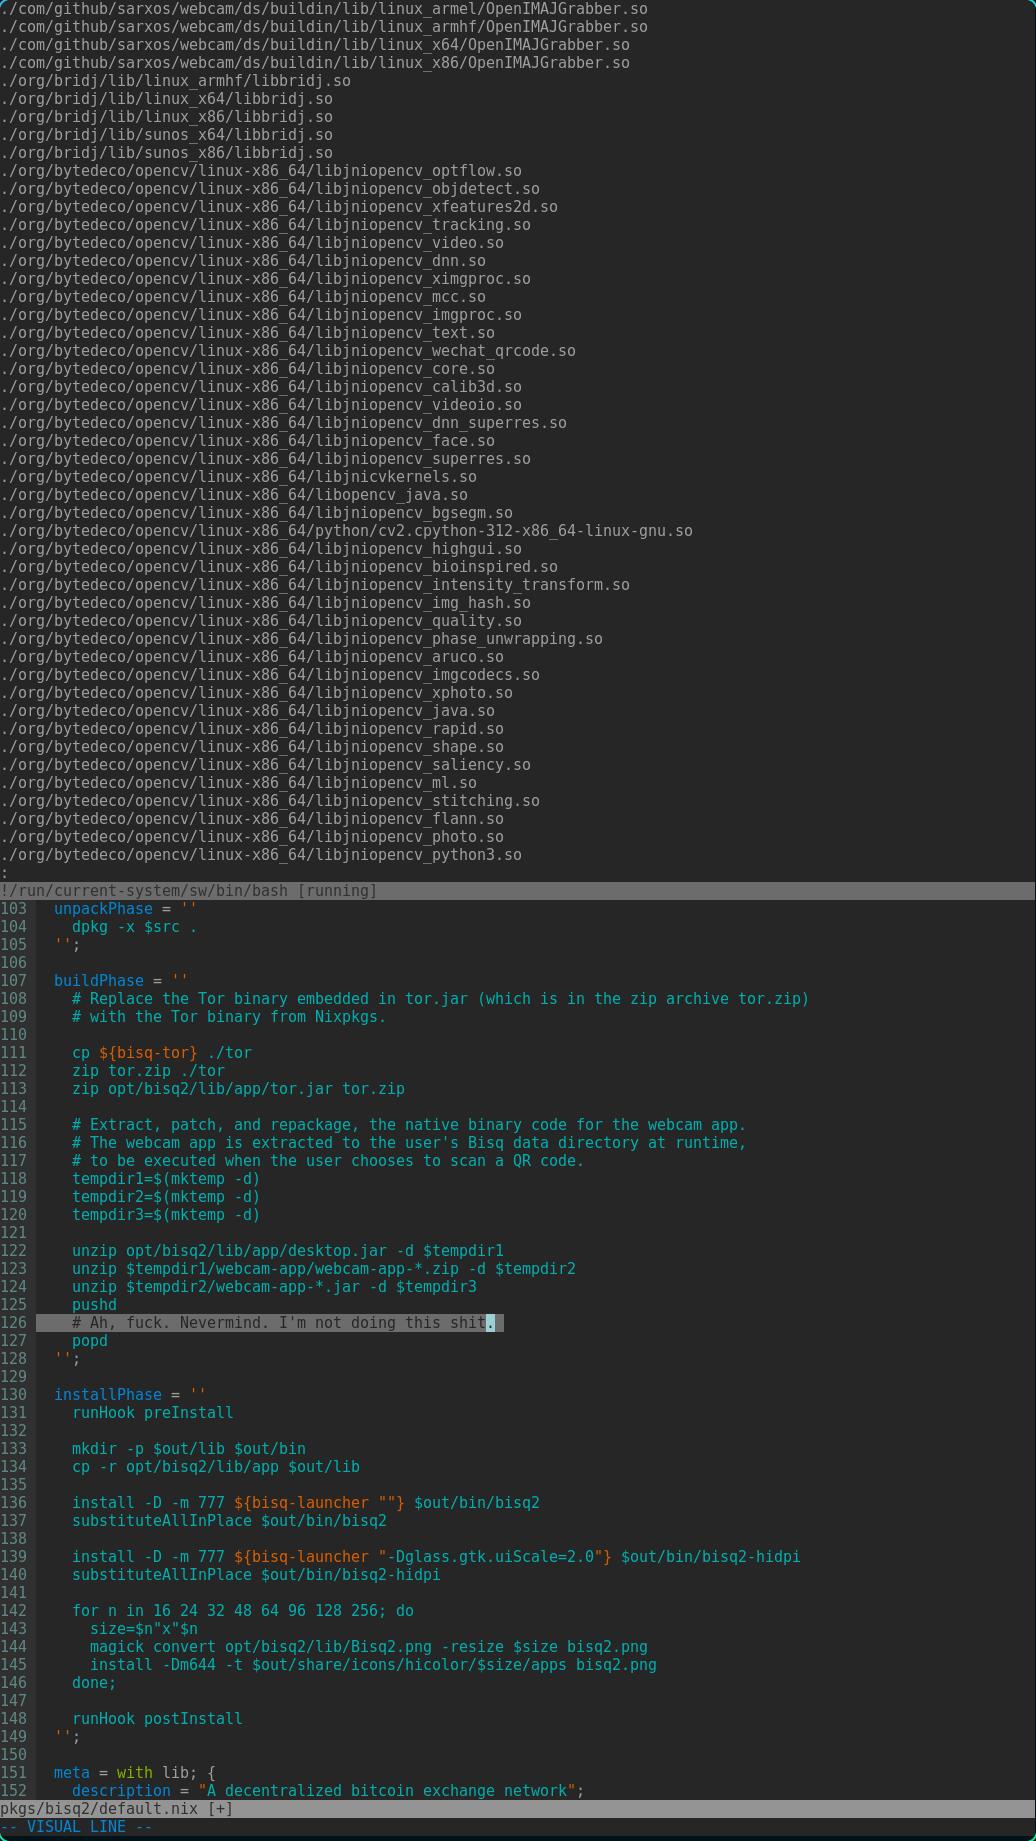
If you run Bisq (@Bisq) version 1 on NixOS (or use the Nix package), I have some bad news.
Bisq 1 relies on an outdated version of OpenJFX, and this version was just removed from Nixpkgs. This makes the Bisq Nix package (in Nixpkgs) broken; It won't build. See  I'm working on a stop-gap solution, but you may want to refrain from updating Nixpkgs master or unstable until you hear back from me.
#bisq #nixos
I'm working on a stop-gap solution, but you may want to refrain from updating Nixpkgs master or unstable until you hear back from me.
#bisq #nixos
GitHub
openjfx11: drop by emilazy · Pull Request #347149 · NixOS/nixpkgs
OpenJFX 11 reached end‐of‐life in 2023.
cc @emmanuelrosa – sorry about the casualty here, but we can’t ship an unsupported multimedia frame...
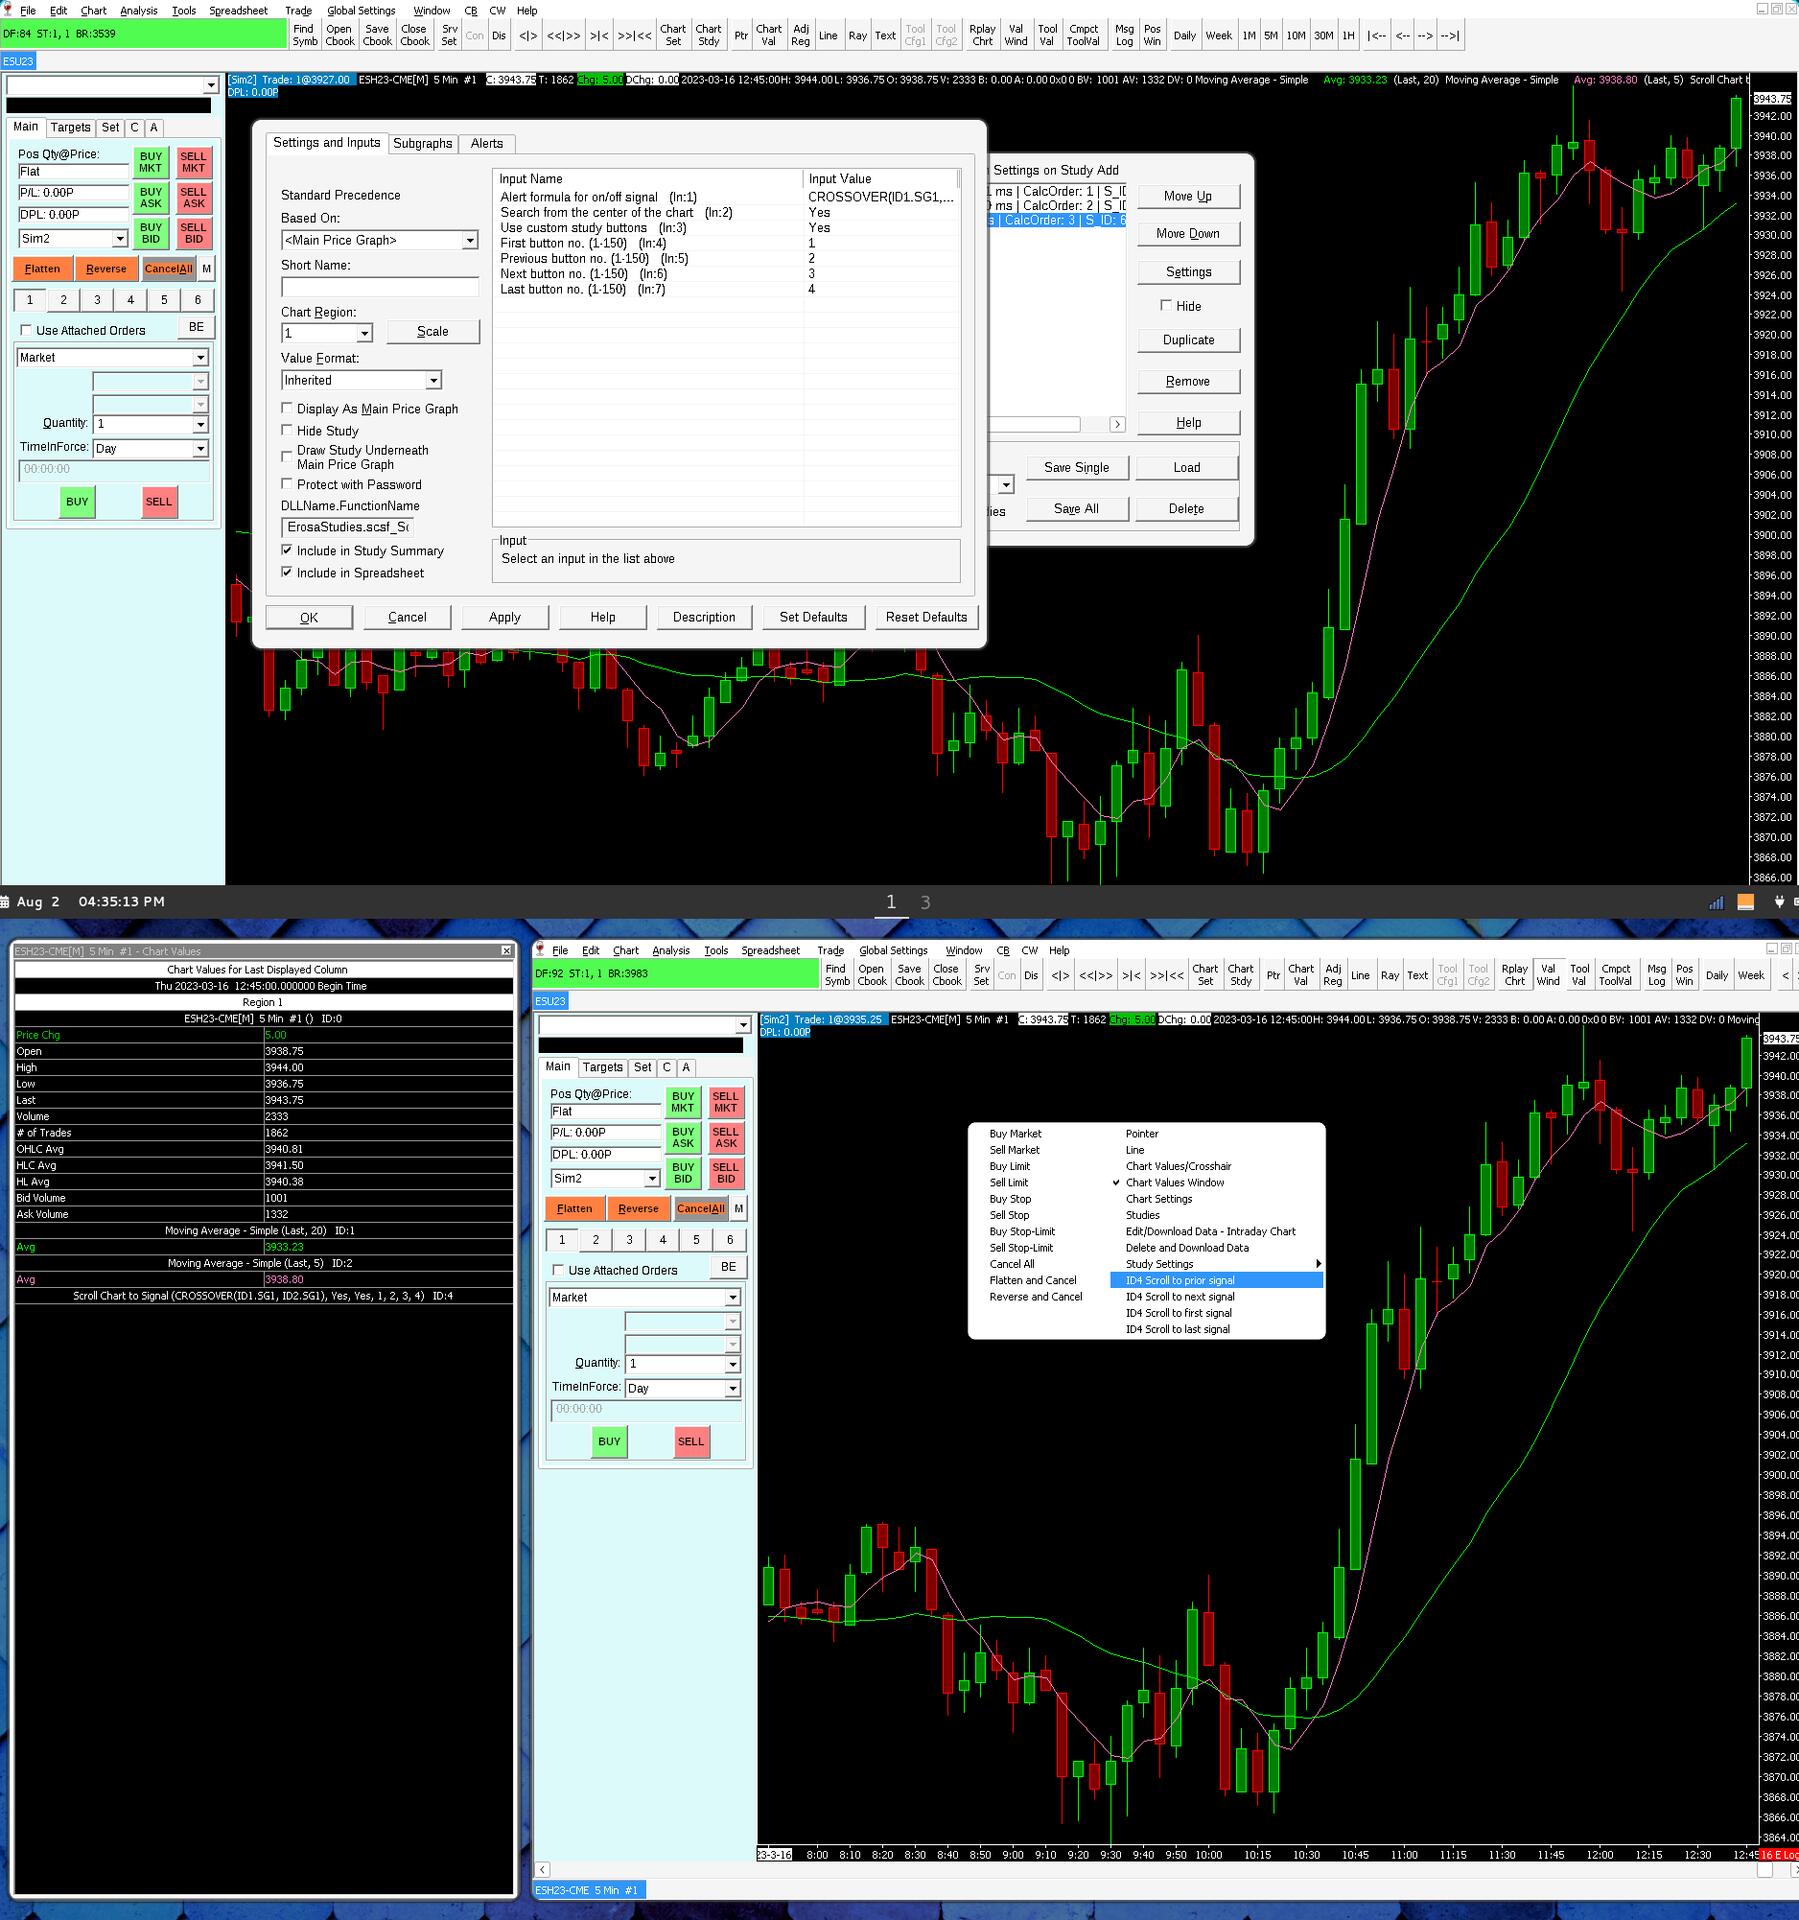 You basically enter an "alert formula" which produces an on/off state; non-zero = ON, 0 = OFF.
The study then provides chart menu options to scroll the chart to the next/previous occurence of the ON state.
The example shown in the screenshot uses a formula which produces an ON state when the two moving averages cross; The formula just uses Sierra Chart's CROSSOVER() function.
But the formula could be something more elaborate. For example... 3 consecutive higher-highs above the 20-period EMA. Whatever it is doesn't matter as long as it produces non-zero and zero values.
The study can fast-forward right through the chart, one mouse-click at a time, showing every single instance wherein the formula produces an ON/TRUE condition :)
You basically enter an "alert formula" which produces an on/off state; non-zero = ON, 0 = OFF.
The study then provides chart menu options to scroll the chart to the next/previous occurence of the ON state.
The example shown in the screenshot uses a formula which produces an ON state when the two moving averages cross; The formula just uses Sierra Chart's CROSSOVER() function.
But the formula could be something more elaborate. For example... 3 consecutive higher-highs above the 20-period EMA. Whatever it is doesn't matter as long as it produces non-zero and zero values.
The study can fast-forward right through the chart, one mouse-click at a time, showing every single instance wherein the formula produces an ON/TRUE condition :) Hint word: Language