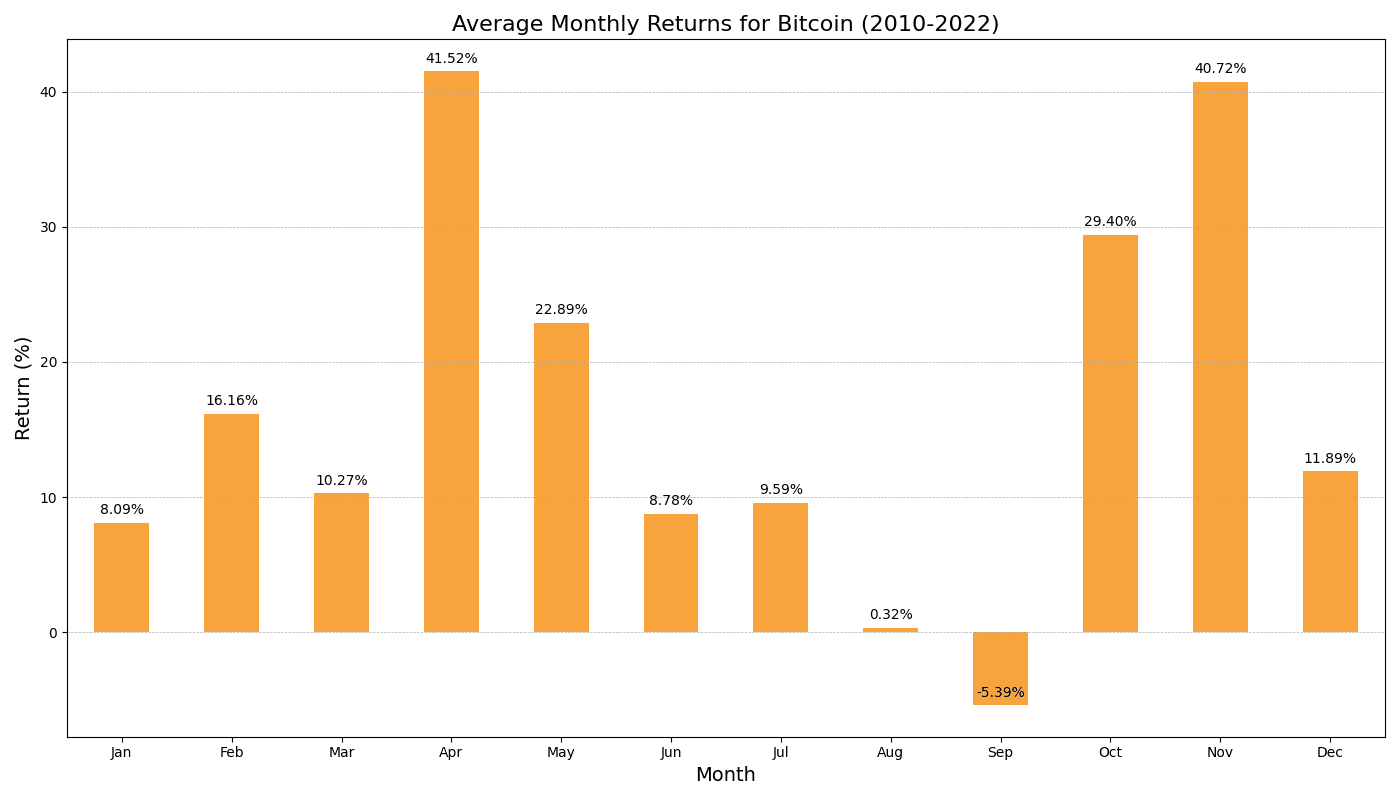
By now, most of you have probably seen a chart similar to this one, which shows that September is historically a seasonally weak month for $BTC.
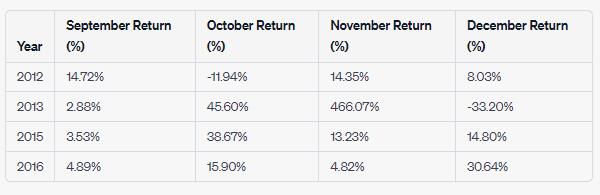 An interesting follow-up question is what does history have to say about months where September was actually positive?
Was the following month and the rest of the year positive?
Interestingly, since 2010, there have been 4 occasions where Sept. had positive returns.
After that, 3/4 had positive returns in October.
All 4/4 had positive returns in November and 3/4 had positive returns in December.
So on net, seasonally, it hasn't paid to be short #Bitcoin in Q4.
An interesting follow-up question is what does history have to say about months where September was actually positive?
Was the following month and the rest of the year positive?
Interestingly, since 2010, there have been 4 occasions where Sept. had positive returns.
After that, 3/4 had positive returns in October.
All 4/4 had positive returns in November and 3/4 had positive returns in December.
So on net, seasonally, it hasn't paid to be short #Bitcoin in Q4.
An interesting follow-up question is what does history have to say about months where September was actually positive?
Was the following month and the rest of the year positive?
Interestingly, since 2010, there have been 4 occasions where Sept. had positive returns.
After that, 3/4 had positive returns in October.
All 4/4 had positive returns in November and 3/4 had positive returns in December.
So on net, seasonally, it hasn't paid to be short #Bitcoin in Q4.
 #BTC #trading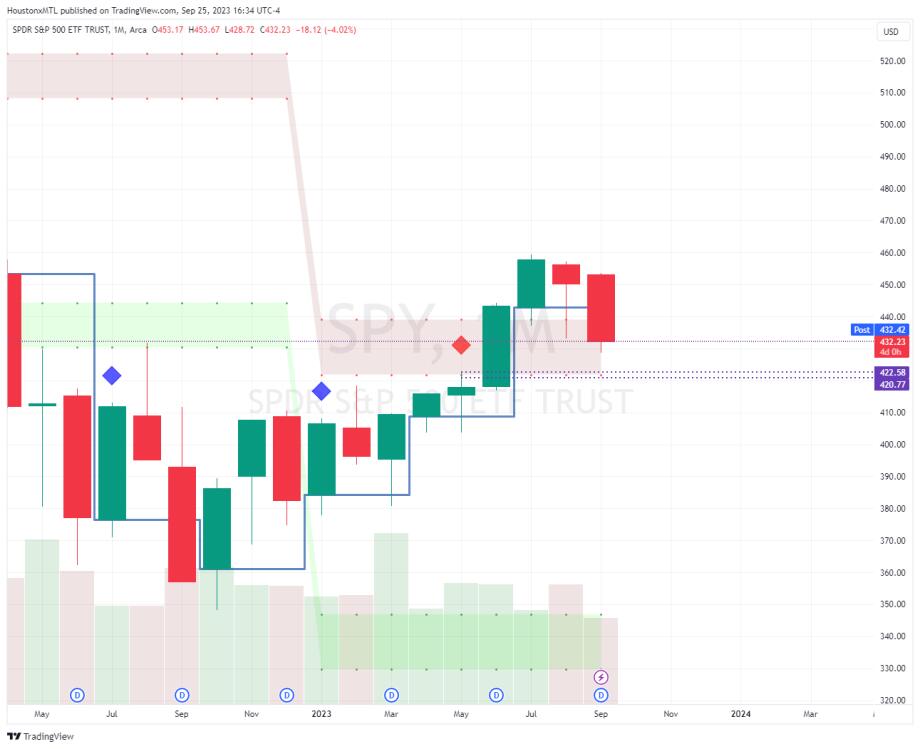
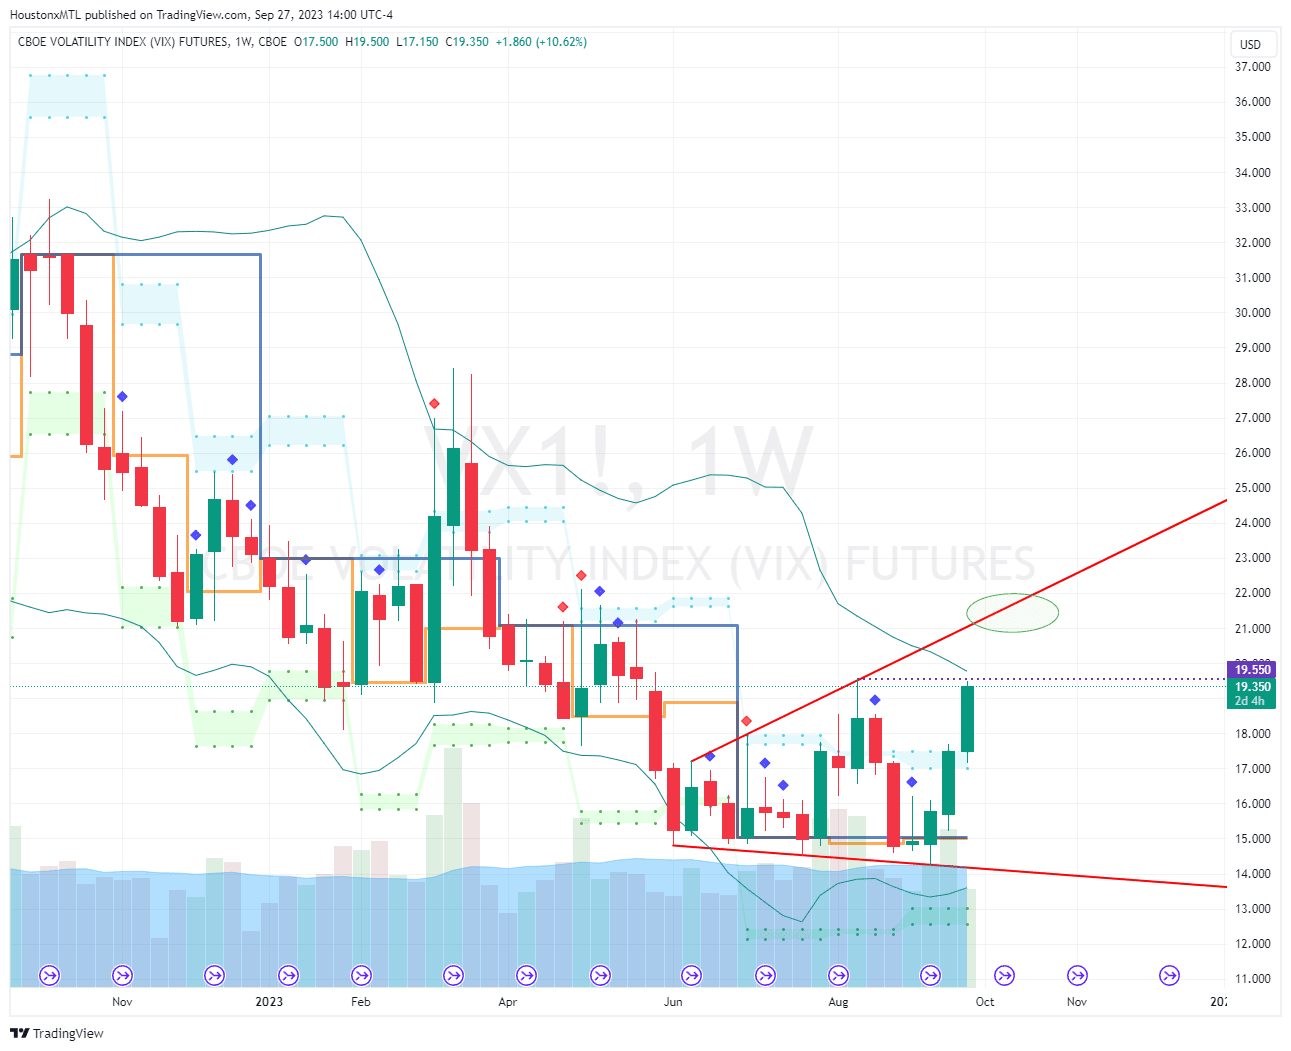




 3 x outside-inside and break to the upside.
The triple outside bar is noteworthy as we can now certainly expect a range extension.
Weekly -
3 x outside-inside and break to the upside.
The triple outside bar is noteworthy as we can now certainly expect a range extension.
Weekly - The weekly chart shows a continuation of the momo up condition. We will see how long this condition will last.
Putting this out there as a possibility - but a re-test of the 200 pivot is a long term possibility and would likely be the result of a very large macro event.
The weekly chart shows a continuation of the momo up condition. We will see how long this condition will last.
Putting this out there as a possibility - but a re-test of the 200 pivot is a long term possibility and would likely be the result of a very large macro event.


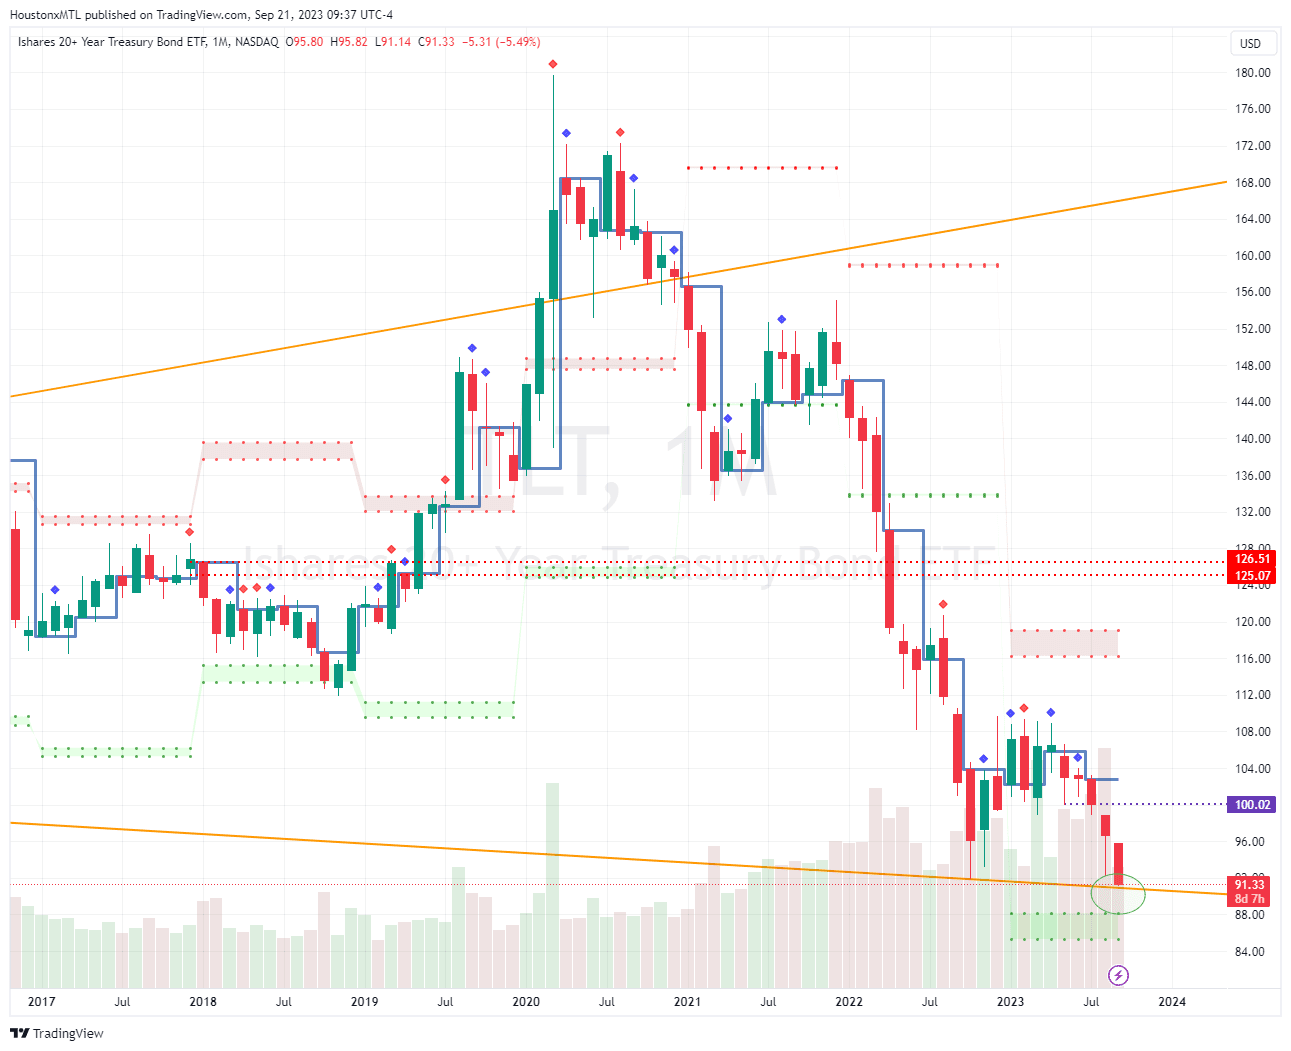 Wild to see $TLT retrace all the way back to 2006 levels.
 ______
I posted the following over a month ago:
______
I posted the following over a month ago: