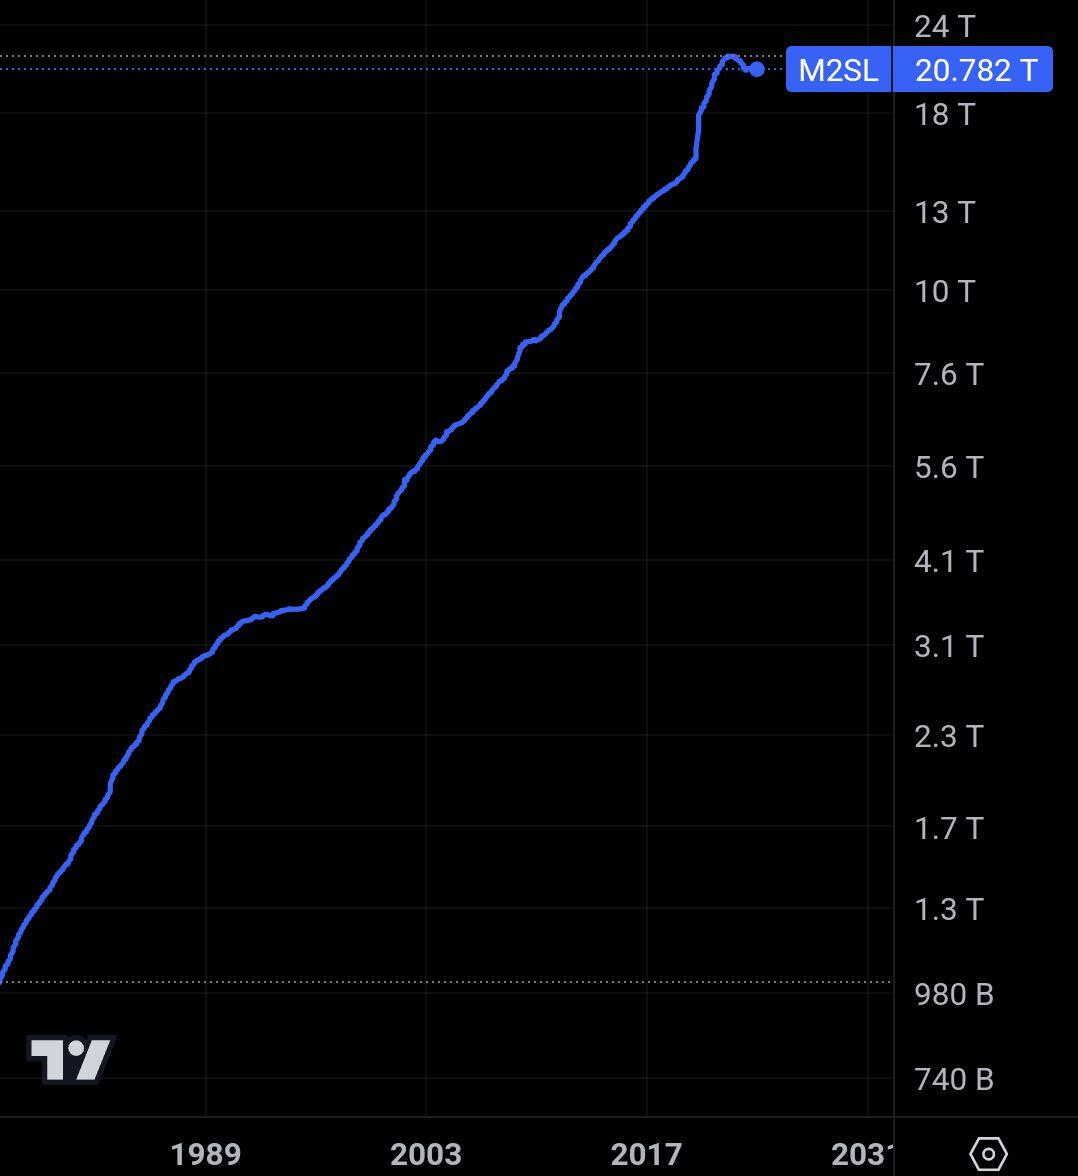
∇ Gradient Descent 1 year ago 1) the chart says "global m2". There's actually other countries outside the US, each with their own policy. 2) US M2 is _almost alwys_ rising. The current QT is the tiny blip at the end of the curve.