
so far so good. new technique seems valid.

 Volatility-Driven Profit Reinvestment Strategy
This technique essentially aims to maximize your trading potential by capitalizing on the natural fluctuations in an asset's value. By buying at a lower price and selling when the price is higher, you can make a profit that you can then reinvest into buying more of the asset during the next dip or oscillation downwards. This allows you to accumulate more of the asset over time without having to invest additional capital from your own pocket.
To illustrate this numerically, let's say you start with 1 unit of an asset and its price fluctuates between $95 and $105 during a single oscillation cycle (this is a simplified example). If you buy when the price hits $95 and sell when it reaches $105, your profit per cycle would be ($105 - $95) = $10.
To clarify the numeric calculation of the percentage increase in your holdings per oscillation cycle, we can use the following formula:
Percentage Increase = ((New Holdings - Initial Holdings) / Initial Holdings) * 100%
In our example, if you start with 1 unit of an asset and buy additional units using the profit generated from selling one unit at $105, your new holdings would be:
Initial Holdings = 1 unit
Profit per cycle = ($105 - $95) = $10
Units purchased with profit = Profit / Price of the asset when you buy = $10 / $95 = 0.105263157895 units
New Holdings = Initial Holdings + Additional Units Purchased = 1 + 0.105263157895 = 1.105263157895 units
Now, we can calculate the percentage increase in your holdings:
Percentage Increase = ((New Holdings - Initial Holdings) / Initial Holdings) * 100%
Percentage Increase = ((1.105263157895 - 1) / 1) * 100%
Percentage Increase ≈ (0.105263157895) * 100%
Percentage Increase ≈ 10.53%
So, your overall holdings in the asset will increase by approximately 10.53% per oscillation cycle when volatility is your friend (volatility helps to create price disparities between buying low and selling high). This technique aims to capitalize on market fluctuations by taking advantage of these price disparities, allowing you to potentially grow your investment without having to constantly inject new funds from your own pocket. By reinvesting profits into additional units during each oscillation cycle, you can increase your overall holdings in an asset, effectively amplifying your gains over time.
Volatility-Driven Profit Reinvestment Strategy
This technique essentially aims to maximize your trading potential by capitalizing on the natural fluctuations in an asset's value. By buying at a lower price and selling when the price is higher, you can make a profit that you can then reinvest into buying more of the asset during the next dip or oscillation downwards. This allows you to accumulate more of the asset over time without having to invest additional capital from your own pocket.
To illustrate this numerically, let's say you start with 1 unit of an asset and its price fluctuates between $95 and $105 during a single oscillation cycle (this is a simplified example). If you buy when the price hits $95 and sell when it reaches $105, your profit per cycle would be ($105 - $95) = $10.
To clarify the numeric calculation of the percentage increase in your holdings per oscillation cycle, we can use the following formula:
Percentage Increase = ((New Holdings - Initial Holdings) / Initial Holdings) * 100%
In our example, if you start with 1 unit of an asset and buy additional units using the profit generated from selling one unit at $105, your new holdings would be:
Initial Holdings = 1 unit
Profit per cycle = ($105 - $95) = $10
Units purchased with profit = Profit / Price of the asset when you buy = $10 / $95 = 0.105263157895 units
New Holdings = Initial Holdings + Additional Units Purchased = 1 + 0.105263157895 = 1.105263157895 units
Now, we can calculate the percentage increase in your holdings:
Percentage Increase = ((New Holdings - Initial Holdings) / Initial Holdings) * 100%
Percentage Increase = ((1.105263157895 - 1) / 1) * 100%
Percentage Increase ≈ (0.105263157895) * 100%
Percentage Increase ≈ 10.53%
So, your overall holdings in the asset will increase by approximately 10.53% per oscillation cycle when volatility is your friend (volatility helps to create price disparities between buying low and selling high). This technique aims to capitalize on market fluctuations by taking advantage of these price disparities, allowing you to potentially grow your investment without having to constantly inject new funds from your own pocket. By reinvesting profits into additional units during each oscillation cycle, you can increase your overall holdings in an asset, effectively amplifying your gains over time.
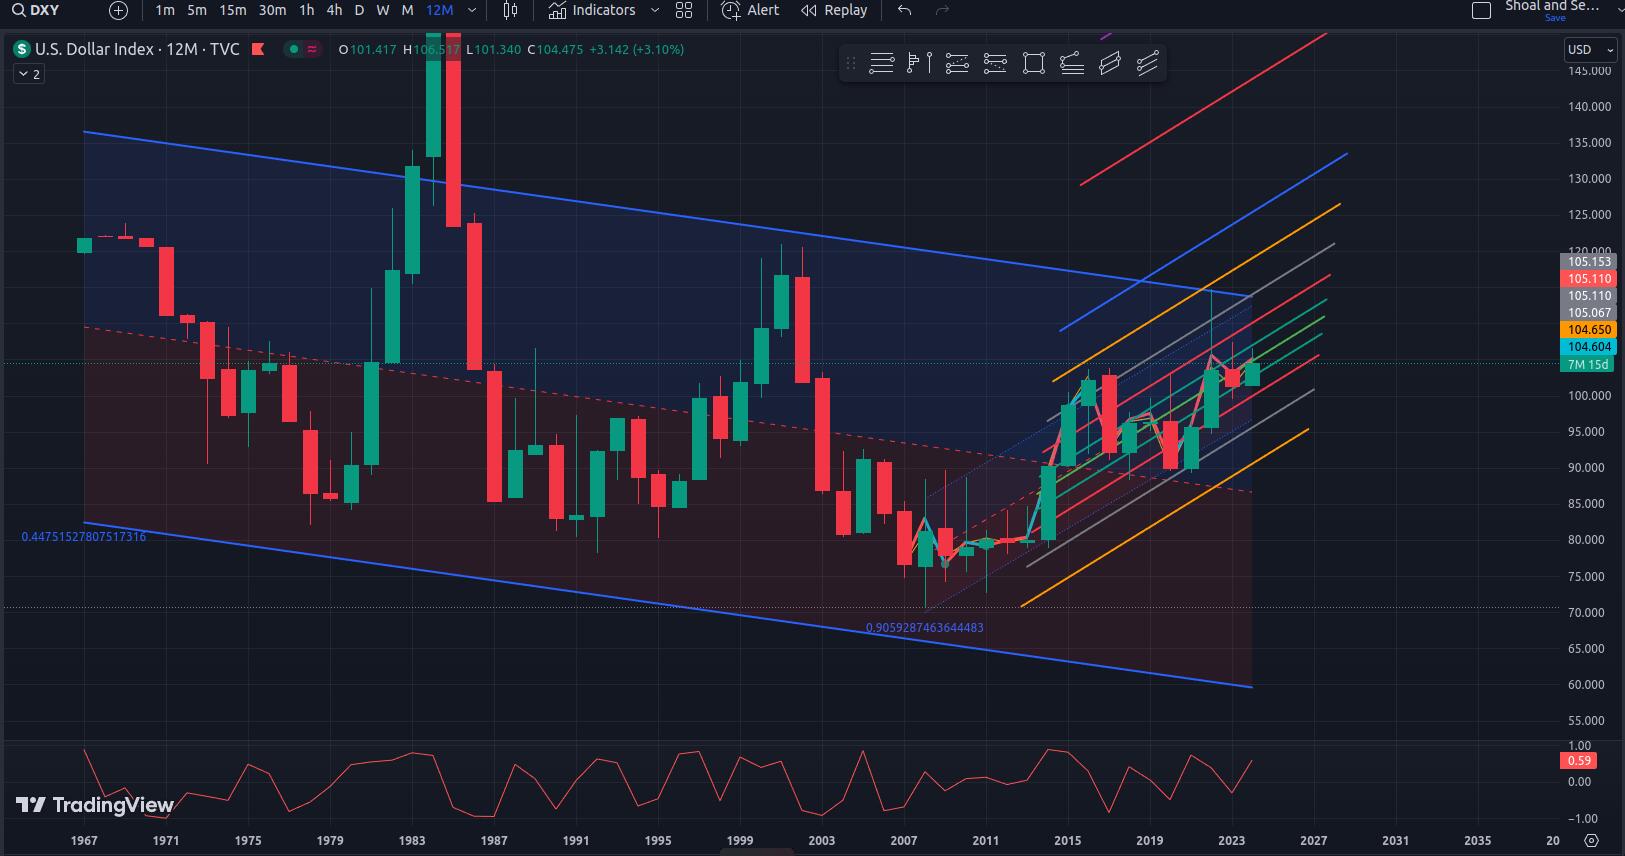
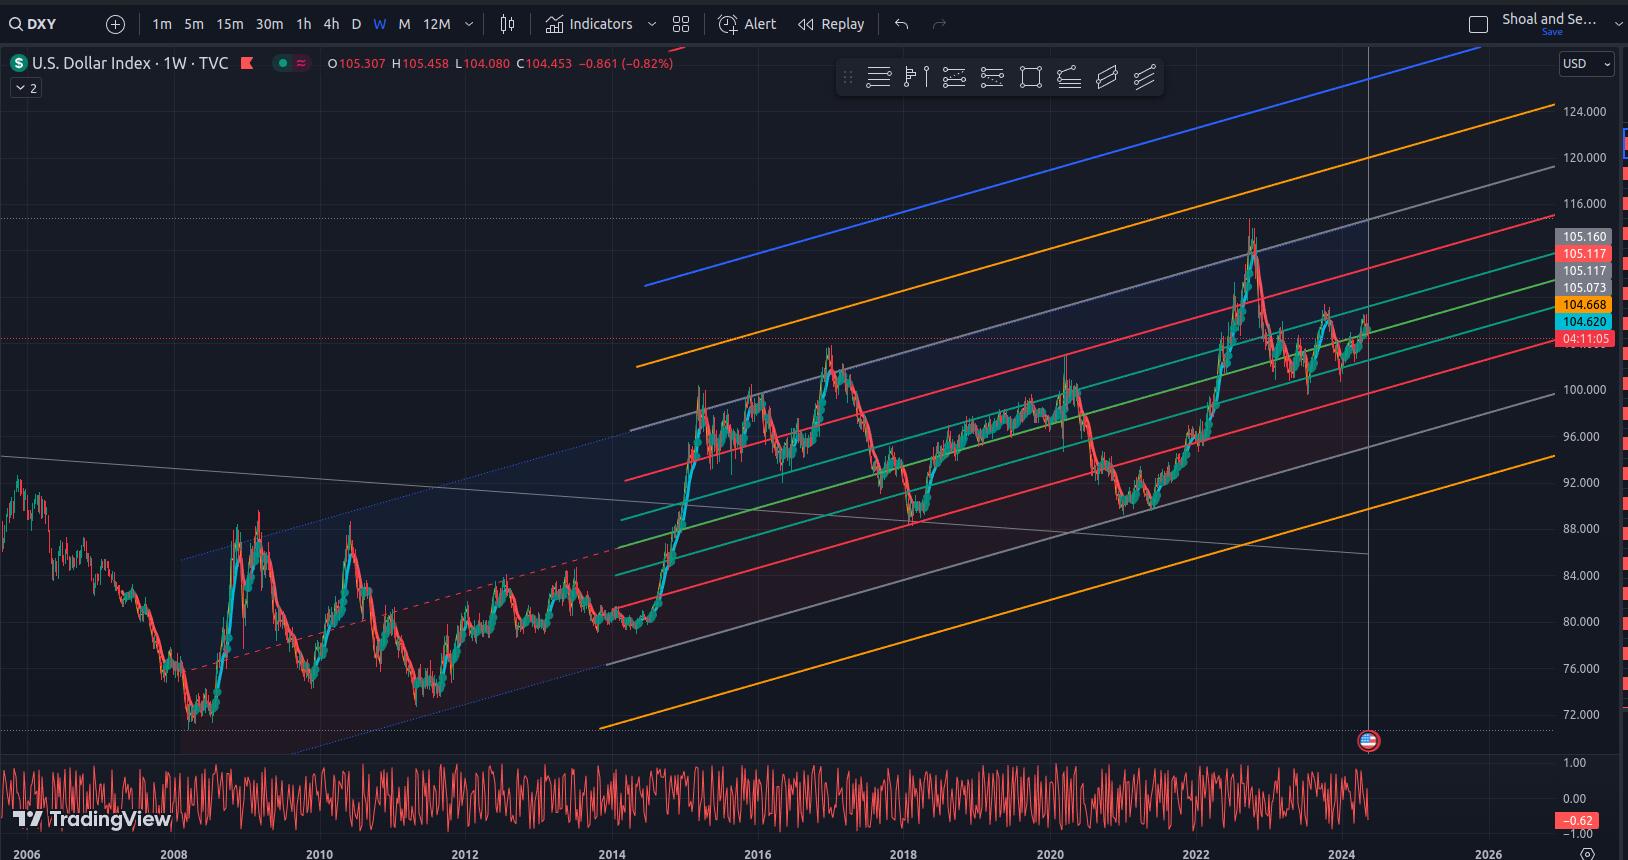 The chart presents a Fibonacci analysis technique, which is used to analyze trends and patterns within financial markets. By applying Fibonacci channels to the slope of a long-term trend, one can observe oscillations occurring within the channel as long as the channel remains valid. This helps demonstrate that the market is not entirely random but follows some predictable patterns. The Fibonacci levels provide potential support and resistance points, which can aid in decision-making for traders or investors. Be aware though that trends are embedded within trends. That is a conversation about Mandelbrot sets that is too deep for this discussion but the image below should illustrate the concept well enough for practical purposes.
 • The chart presents a Fibonacci analysis technique (12).
• This technique is used to analyze trends and patterns within financial markets (345).
• By applying Fibonacci channels to the slope of a long-term trend, one can observe oscillations occurring within the channel as long as the channel remains valid (67).
• The Fibonacci levels provide potential support and resistance points (8910111213).
• This helps in decision-making for traders or investors (14).
Technique:
• The chart presents a Fibonacci analysis technique (12).
• This technique is used to analyze trends and patterns within financial markets (345).
• By applying Fibonacci channels to the slope of a long-term trend, one can observe oscillations occurring within the channel as long as the channel remains valid (67).
• The Fibonacci levels provide potential support and resistance points (8910111213).
• This helps in decision-making for traders or investors (14).
Technique:
 The technique involves identifying the Fibonacci channels within a long-term trend, with the goal of scaling buys near the bottom of the channel and sells near the top. This approach aims to maximize potential gains while minimizing losses by placing stop-loss orders safely below the channel.
As the channel ascends, traders should move their stop-loss orders up into profitable territory, effectively "locking in" profits along the way.
This analytical approach relies on the premise that financial markets follow recurring patterns, and using Fibonacci channels can help identify those patterns more easily. By scaling trades at key support and resistance levels within the channel, traders can potentially maximize their gains while minimizing losses. However, it is essential to remember that no trading strategy guarantees success, and even with this technique, there will always be some degree of risk involved.
• The technique involves identifying the Fibonacci channels within a long-term trend (15).
• he goal is to scale buys near the bottom of the channel and sells near the top (37).
• This approach aims to maximize potential gains while minimizing losses by placing stop-loss orders safely below the channel (67).
• As the channel ascends, traders should move their stop-loss orders up into profitable territory, effectively "locking in" profits along the way (612).
• This analytical approach relies on the premise that financial markets follow recurring patterns (457).
• Using Fibonacci channels can help identify those patterns more easily (8910111213).
• By scaling trades at key support and resistance levels within the channel, traders can potentially maximize their gains while minimizing losses (16).
Citations:
[1]
The technique involves identifying the Fibonacci channels within a long-term trend, with the goal of scaling buys near the bottom of the channel and sells near the top. This approach aims to maximize potential gains while minimizing losses by placing stop-loss orders safely below the channel.
As the channel ascends, traders should move their stop-loss orders up into profitable territory, effectively "locking in" profits along the way.
This analytical approach relies on the premise that financial markets follow recurring patterns, and using Fibonacci channels can help identify those patterns more easily. By scaling trades at key support and resistance levels within the channel, traders can potentially maximize their gains while minimizing losses. However, it is essential to remember that no trading strategy guarantees success, and even with this technique, there will always be some degree of risk involved.
• The technique involves identifying the Fibonacci channels within a long-term trend (15).
• he goal is to scale buys near the bottom of the channel and sells near the top (37).
• This approach aims to maximize potential gains while minimizing losses by placing stop-loss orders safely below the channel (67).
• As the channel ascends, traders should move their stop-loss orders up into profitable territory, effectively "locking in" profits along the way (612).
• This analytical approach relies on the premise that financial markets follow recurring patterns (457).
• Using Fibonacci channels can help identify those patterns more easily (8910111213).
• By scaling trades at key support and resistance levels within the channel, traders can potentially maximize their gains while minimizing losses (16).
Citations:
[1] 


:max_bytes(150000):strip_icc()/GettyImages-637016134-cde4d8d4a7944f2dad71faf351598e12.jpg)


:max_bytes(150000):strip_icc()/GettyImages-637016966-3aef44701624445d9c6f17595d2af411.jpg)
:max_bytes(150000):strip_icc()/GettyImages-2074435669-2cf1ba50572d485f920189bdd57bb651.jpg)
:max_bytes(150000):strip_icc()/inverse-head-and-shoulders-4194370-1-4cbe97fa488942a79e874221dcc6d8ab.jpg)