
Golden Ratio Market Strategy
The Chart:
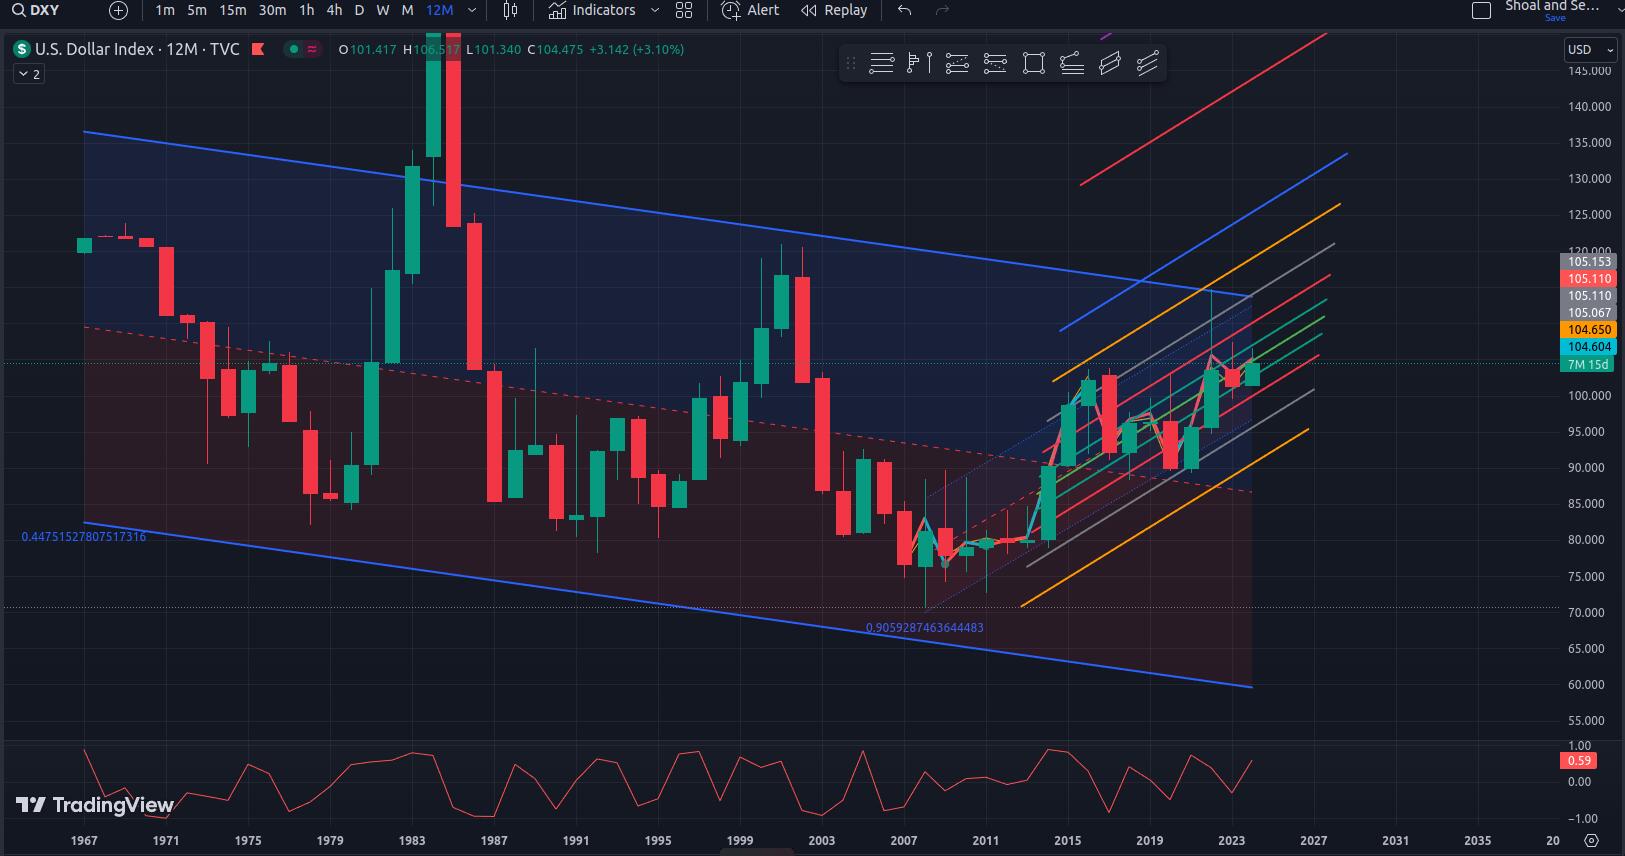
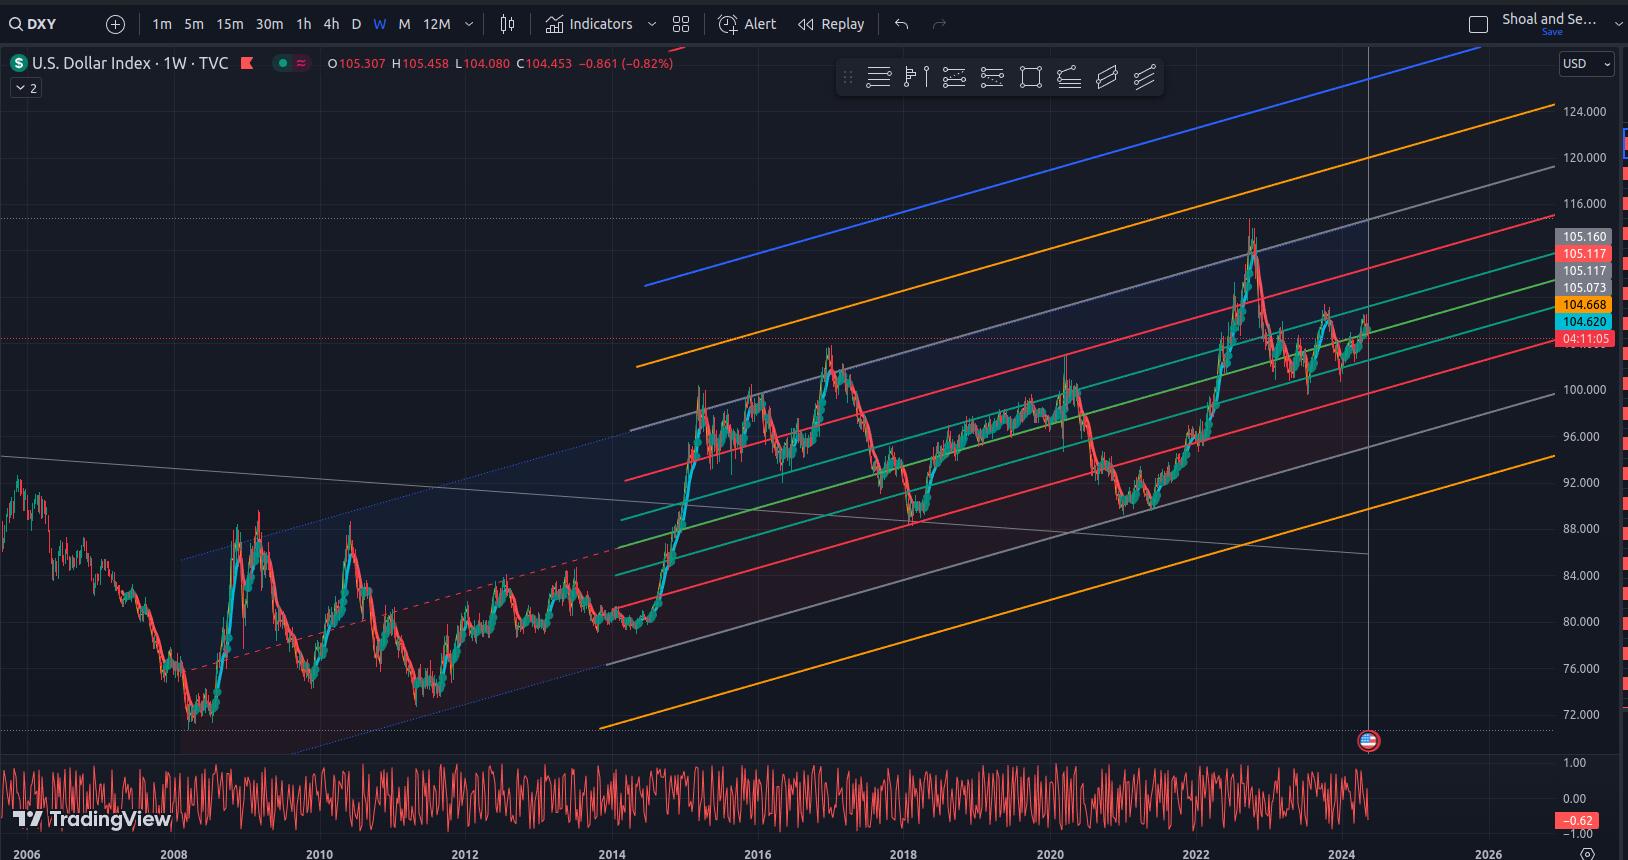 The chart presents a Fibonacci analysis technique, which is used to analyze trends and patterns within financial markets. By applying Fibonacci channels to the slope of a long-term trend, one can observe oscillations occurring within the channel as long as the channel remains valid. This helps demonstrate that the market is not entirely random but follows some predictable patterns. The Fibonacci levels provide potential support and resistance points, which can aid in decision-making for traders or investors. Be aware though that trends are embedded within trends. That is a conversation about Mandelbrot sets that is too deep for this discussion but the image below should illustrate the concept well enough for practical purposes.
 • The chart presents a Fibonacci analysis technique (12).
• This technique is used to analyze trends and patterns within financial markets (345).
• By applying Fibonacci channels to the slope of a long-term trend, one can observe oscillations occurring within the channel as long as the channel remains valid (67).
• The Fibonacci levels provide potential support and resistance points (8910111213).
• This helps in decision-making for traders or investors (14).
Technique:
• The chart presents a Fibonacci analysis technique (12).
• This technique is used to analyze trends and patterns within financial markets (345).
• By applying Fibonacci channels to the slope of a long-term trend, one can observe oscillations occurring within the channel as long as the channel remains valid (67).
• The Fibonacci levels provide potential support and resistance points (8910111213).
• This helps in decision-making for traders or investors (14).
Technique:
 The technique involves identifying the Fibonacci channels within a long-term trend, with the goal of scaling buys near the bottom of the channel and sells near the top. This approach aims to maximize potential gains while minimizing losses by placing stop-loss orders safely below the channel.
As the channel ascends, traders should move their stop-loss orders up into profitable territory, effectively "locking in" profits along the way.
This analytical approach relies on the premise that financial markets follow recurring patterns, and using Fibonacci channels can help identify those patterns more easily. By scaling trades at key support and resistance levels within the channel, traders can potentially maximize their gains while minimizing losses. However, it is essential to remember that no trading strategy guarantees success, and even with this technique, there will always be some degree of risk involved.
• The technique involves identifying the Fibonacci channels within a long-term trend (15).
• he goal is to scale buys near the bottom of the channel and sells near the top (37).
• This approach aims to maximize potential gains while minimizing losses by placing stop-loss orders safely below the channel (67).
• As the channel ascends, traders should move their stop-loss orders up into profitable territory, effectively "locking in" profits along the way (612).
• This analytical approach relies on the premise that financial markets follow recurring patterns (457).
• Using Fibonacci channels can help identify those patterns more easily (8910111213).
• By scaling trades at key support and resistance levels within the channel, traders can potentially maximize their gains while minimizing losses (16).
Citations:
[1]
The technique involves identifying the Fibonacci channels within a long-term trend, with the goal of scaling buys near the bottom of the channel and sells near the top. This approach aims to maximize potential gains while minimizing losses by placing stop-loss orders safely below the channel.
As the channel ascends, traders should move their stop-loss orders up into profitable territory, effectively "locking in" profits along the way.
This analytical approach relies on the premise that financial markets follow recurring patterns, and using Fibonacci channels can help identify those patterns more easily. By scaling trades at key support and resistance levels within the channel, traders can potentially maximize their gains while minimizing losses. However, it is essential to remember that no trading strategy guarantees success, and even with this technique, there will always be some degree of risk involved.
• The technique involves identifying the Fibonacci channels within a long-term trend (15).
• he goal is to scale buys near the bottom of the channel and sells near the top (37).
• This approach aims to maximize potential gains while minimizing losses by placing stop-loss orders safely below the channel (67).
• As the channel ascends, traders should move their stop-loss orders up into profitable territory, effectively "locking in" profits along the way (612).
• This analytical approach relies on the premise that financial markets follow recurring patterns (457).
• Using Fibonacci channels can help identify those patterns more easily (8910111213).
• By scaling trades at key support and resistance levels within the channel, traders can potentially maximize their gains while minimizing losses (16).
Citations:
[1]  [2] https://www.quora.com/What-is-the-best-Forex-trading-strategy-using-Fibonacci-retracement-and-extension-levels-with-MACD-RSI-CCI-etc
[3]
[2] https://www.quora.com/What-is-the-best-Forex-trading-strategy-using-Fibonacci-retracement-and-extension-levels-with-MACD-RSI-CCI-etc
[3]  [4]
[4]  [5]
[5]  [6]
[6]  [7]
[8]
[7]
[8] :max_bytes(150000):strip_icc()/GettyImages-637016134-cde4d8d4a7944f2dad71faf351598e12.jpg) [9]
[9]  [10] https://www.warriortrading.com/fibonacci-retracement-definition/
[11]
[10] https://www.warriortrading.com/fibonacci-retracement-definition/
[11]  [12]
[13]
[12]
[13] :max_bytes(150000):strip_icc()/GettyImages-637016966-3aef44701624445d9c6f17595d2af411.jpg) [14]
[14] :max_bytes(150000):strip_icc()/GettyImages-2074435669-2cf1ba50572d485f920189bdd57bb651.jpg) [15]
[15] :max_bytes(150000):strip_icc()/inverse-head-and-shoulders-4194370-1-4cbe97fa488942a79e874221dcc6d8ab.jpg)
The chart presents a Fibonacci analysis technique, which is used to analyze trends and patterns within financial markets. By applying Fibonacci channels to the slope of a long-term trend, one can observe oscillations occurring within the channel as long as the channel remains valid. This helps demonstrate that the market is not entirely random but follows some predictable patterns. The Fibonacci levels provide potential support and resistance points, which can aid in decision-making for traders or investors. Be aware though that trends are embedded within trends. That is a conversation about Mandelbrot sets that is too deep for this discussion but the image below should illustrate the concept well enough for practical purposes.
• The chart presents a Fibonacci analysis technique (12).
• This technique is used to analyze trends and patterns within financial markets (345).
• By applying Fibonacci channels to the slope of a long-term trend, one can observe oscillations occurring within the channel as long as the channel remains valid (67).
• The Fibonacci levels provide potential support and resistance points (8910111213).
• This helps in decision-making for traders or investors (14).
Technique:
The technique involves identifying the Fibonacci channels within a long-term trend, with the goal of scaling buys near the bottom of the channel and sells near the top. This approach aims to maximize potential gains while minimizing losses by placing stop-loss orders safely below the channel.
As the channel ascends, traders should move their stop-loss orders up into profitable territory, effectively "locking in" profits along the way.
This analytical approach relies on the premise that financial markets follow recurring patterns, and using Fibonacci channels can help identify those patterns more easily. By scaling trades at key support and resistance levels within the channel, traders can potentially maximize their gains while minimizing losses. However, it is essential to remember that no trading strategy guarantees success, and even with this technique, there will always be some degree of risk involved.
• The technique involves identifying the Fibonacci channels within a long-term trend (15).
• he goal is to scale buys near the bottom of the channel and sells near the top (37).
• This approach aims to maximize potential gains while minimizing losses by placing stop-loss orders safely below the channel (67).
• As the channel ascends, traders should move their stop-loss orders up into profitable territory, effectively "locking in" profits along the way (612).
• This analytical approach relies on the premise that financial markets follow recurring patterns (457).
• Using Fibonacci channels can help identify those patterns more easily (8910111213).
• By scaling trades at key support and resistance levels within the channel, traders can potentially maximize their gains while minimizing losses (16).
Citations:
[1] FXTM Academy | Learn to trade | FXTM
Are you a beginner or advanced See our knowledge hub for in depth articles, guides, webinars and videos that are here to help you learn how to trade.
Fibonacci Trading Strategy: A Complete Guide
Learn Fibonacci trading strategies with retracements, extensions, and key Fibonacci levels. Understand how Fibonacci ratios guide market trends acr...
Fibonacci retracement - Wikipedia
Three Fibonacci Trading Strategies + Infographic & Video | TradingSim
Completely demystify how to trade with Fibonacci using these 3 simple Fibonacci trading strategies you can test today. Plus a cool Fibonacci infogr...
FasterCapital
Fibonacci Retracement: Confirming Chart Based Levels for Precision Trading - FasterCapital
Fibonacci retracement is a popular technical analysis tool used by traders to identify potential levels of support and resistance in financial mark...
FasterCapital
The Winning Combination Of Take Profit And Fibonacci Retracement - FasterCapital
In this page you can find various blogs and articles that are related to this topic: The Winning Combination Of Take Profit And Fibonacci Retracement
Investopedia
Master Fibonacci Strategies for Stock Market Success
Discover Fibonacci techniques to identify stock patterns and optimize entry/exit points, enhancing your trading profits with proven strategies.
Slideshare
Fibonacci Retracement – 5 Best Tips for Master Fibonacci Retracement.pdf
The document discusses Fibonacci retracement as a technical analysis tool that helps traders identify potential support and resistance levels based...
CMC Markets
CFDs & Forex Trading Platform | Trade | CMC Markets
Trade with leverage on forex, indices, commodities, cryptos, shares, and more. Choose from over 10,000 instruments on MT4, MT5, TradingView and Ne...
How To Use Fibonacci (Golden Ratio) In Trading Strategy - Hantec Markets
Learn what is and how to use a Fibonacci (Golden Ratio) to identify possible areas of support and resistance and decide when to open and close a po...
Investopedia
Understanding Fibonacci Retracements and Ratios for Trading Success
Discover how Fibonacci retracements and ratios can help traders draw support lines, identify resistance levels, and optimize trading strategies for...
Investopedia
Strategies for Trading Fibonacci Retracement Levels
Fibonacci retracement levels are depicted by taking high and low points on a chart, marking the key ratios, and using them in a trend-trading strat...
Investopedia
Understanding the Inverse Head and Shoulders Pattern: A Key to Trading Reversals
Discover how the inverse head and shoulders pattern signals bullish reversals in downtrends, helping traders identify potential entry points and ma...
