therationalroot's avatar
therationalroot
therationalroot@nostr.directory
npub1r00t...sqe8
#Bitcoin on-chain & cycle analysis. Signal only. Follow the carrot down the rabbit hole.
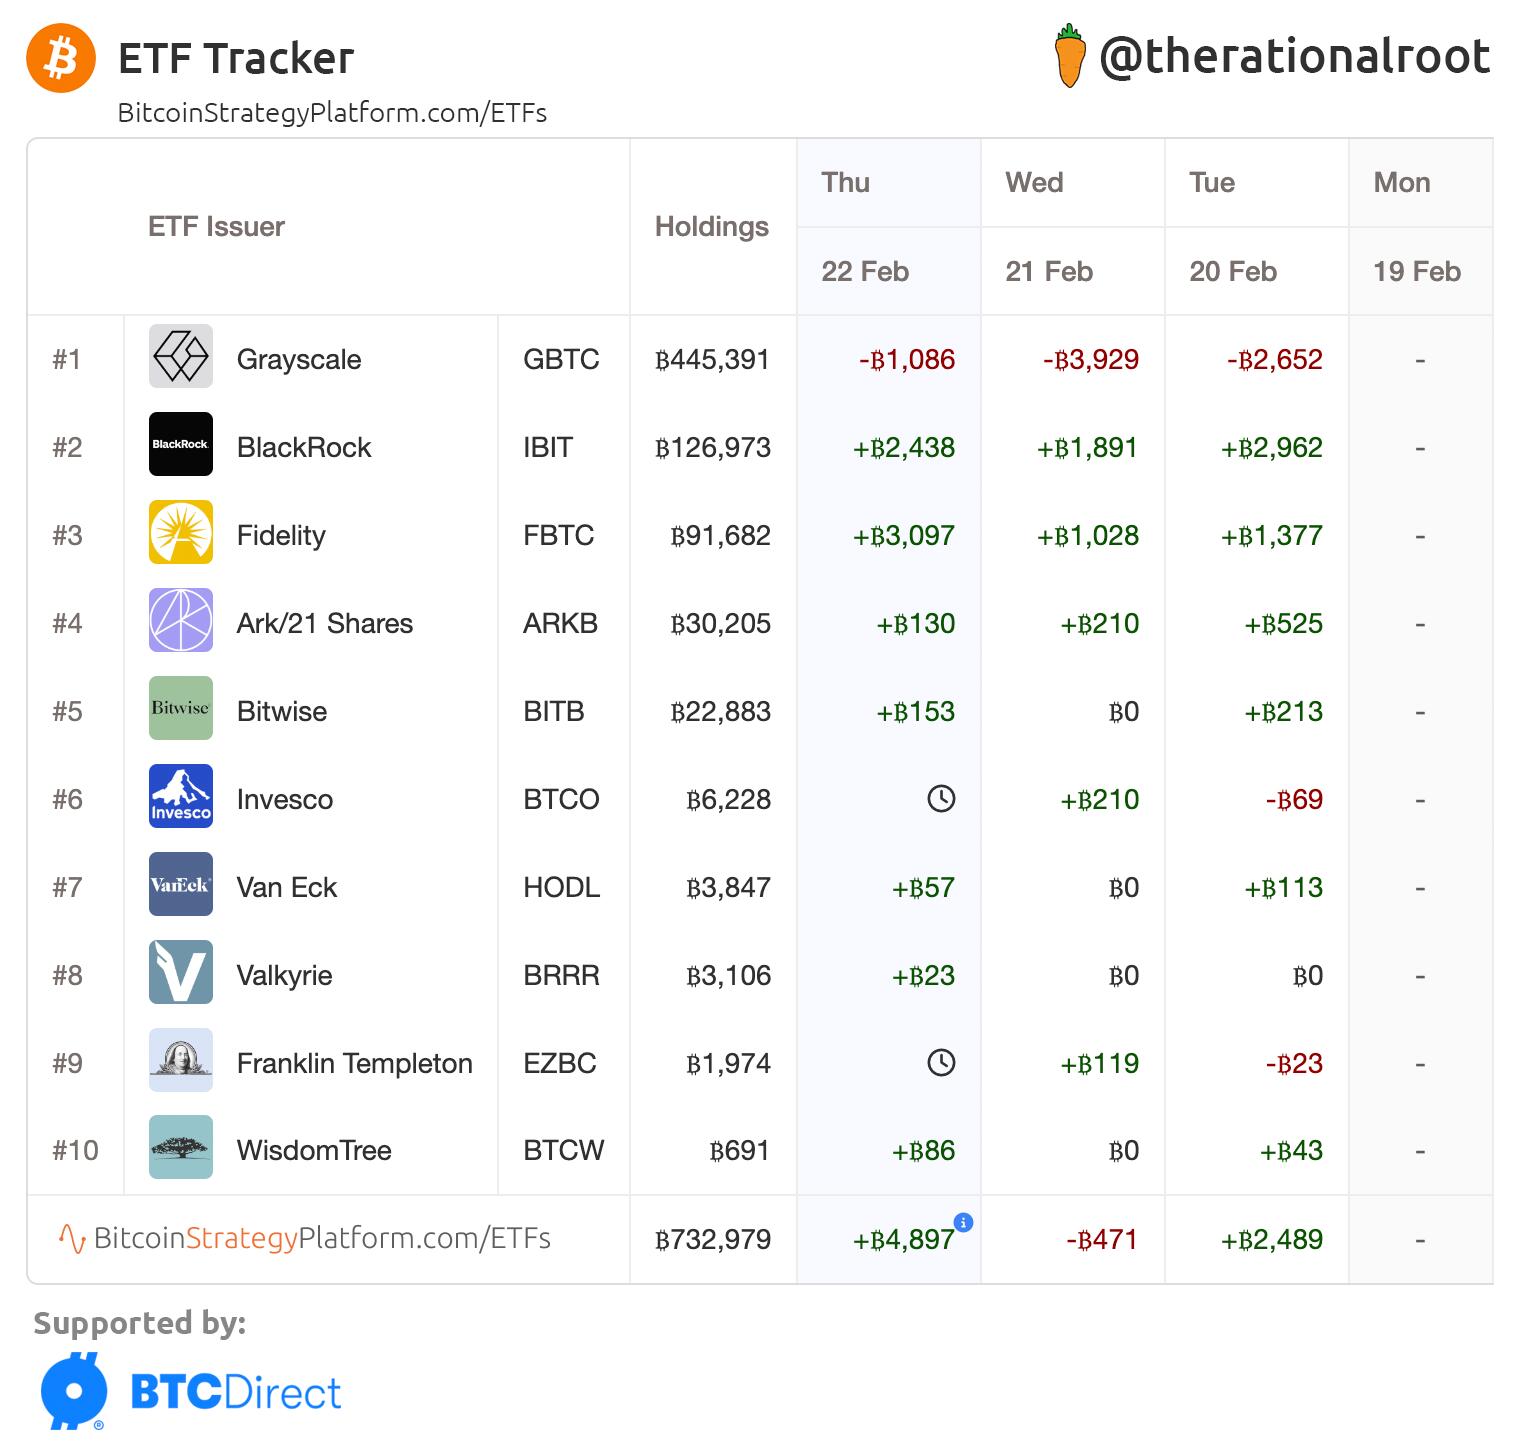
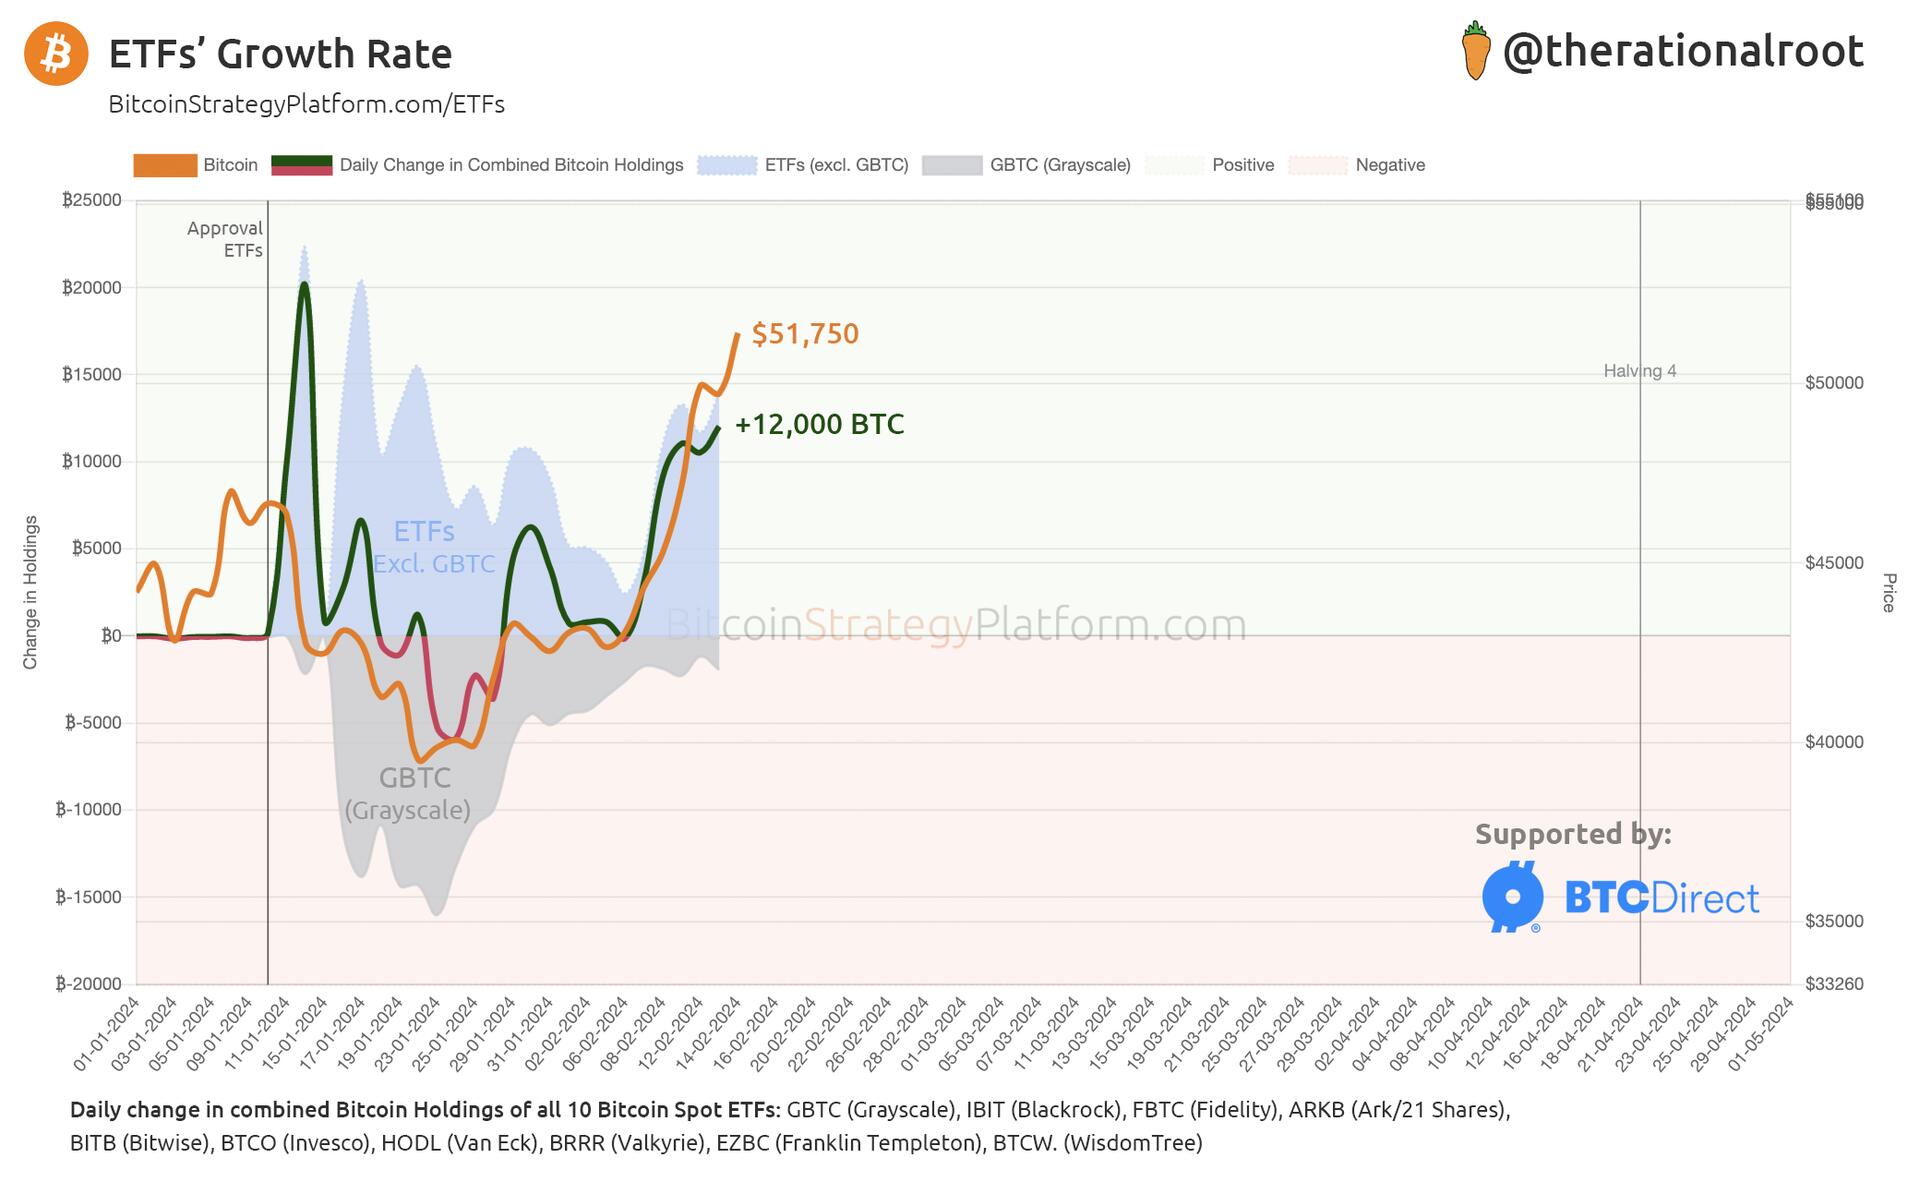
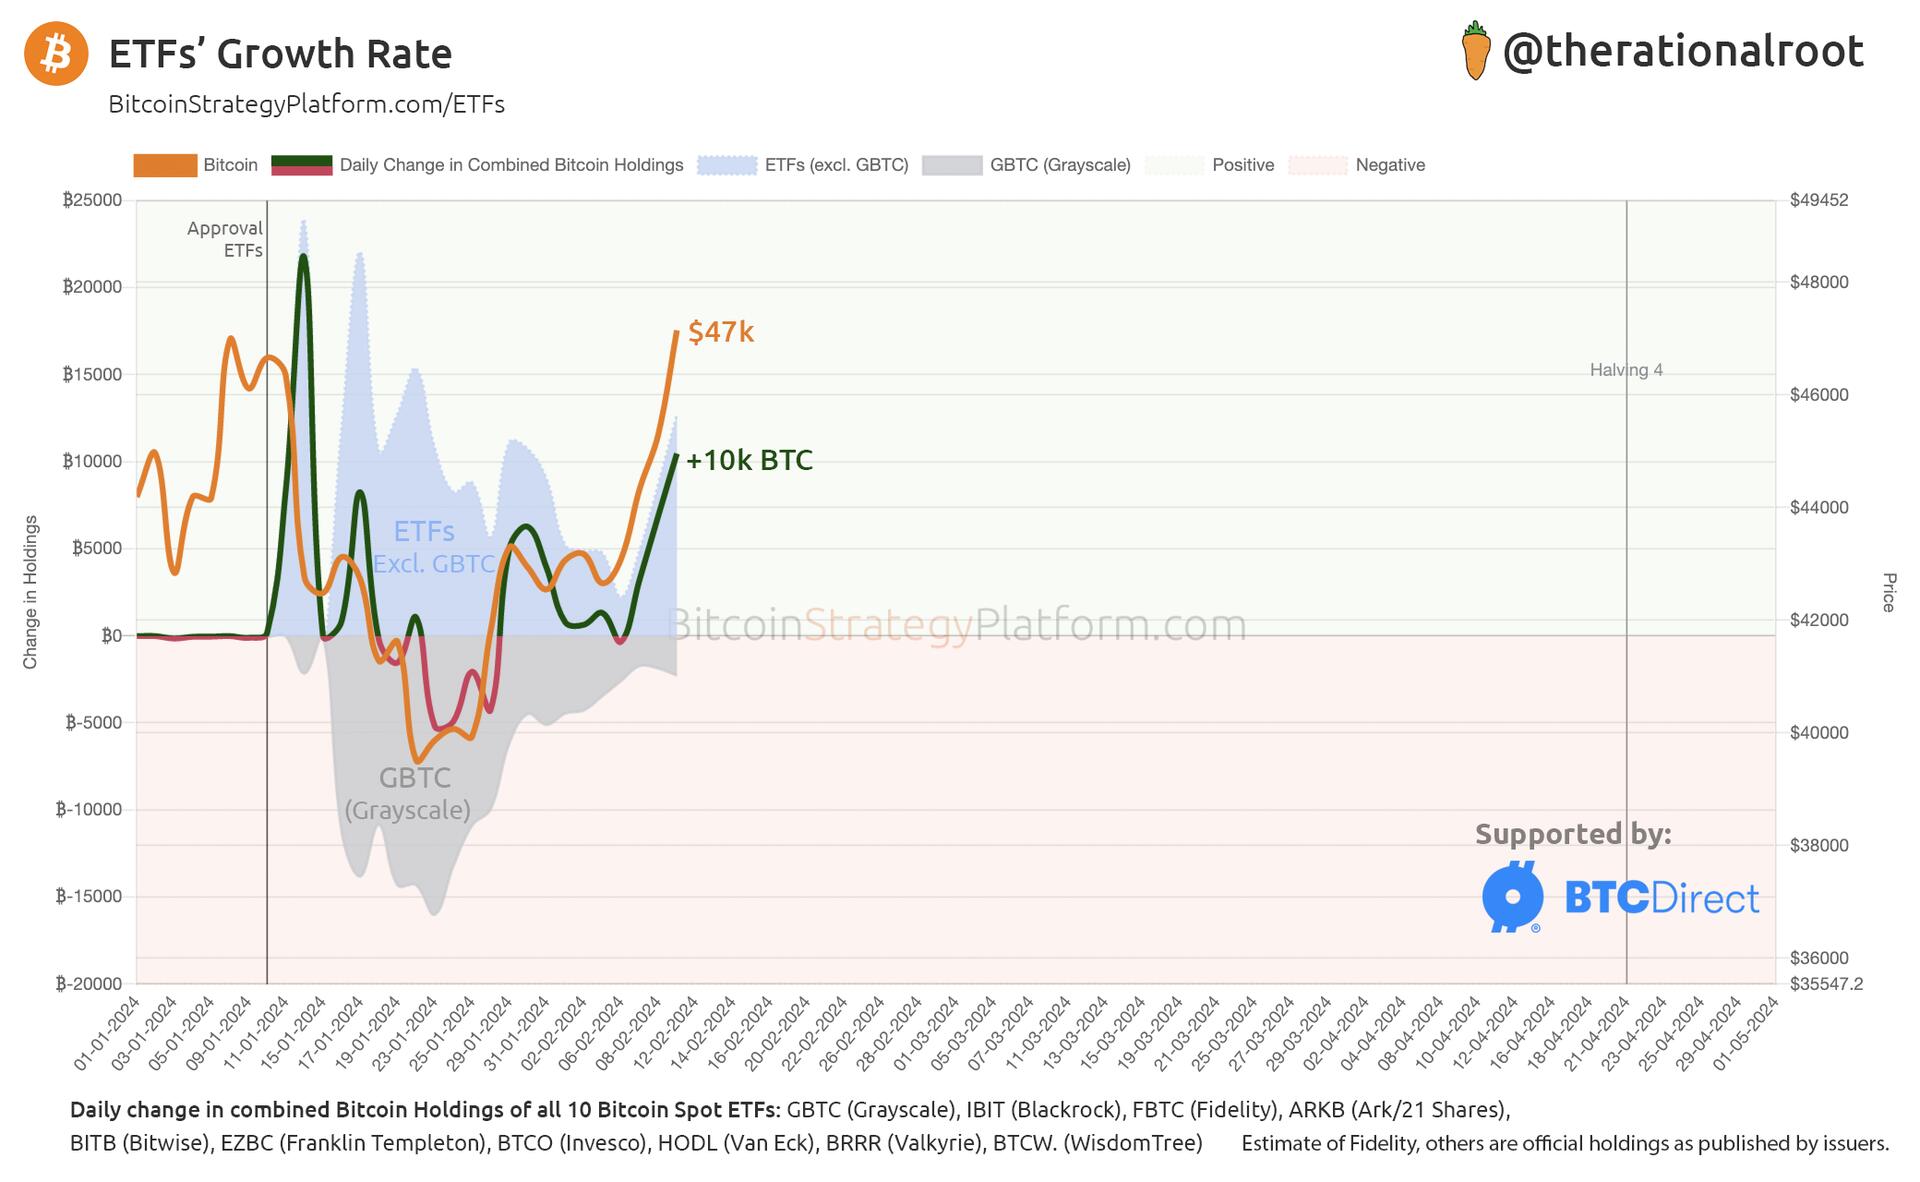
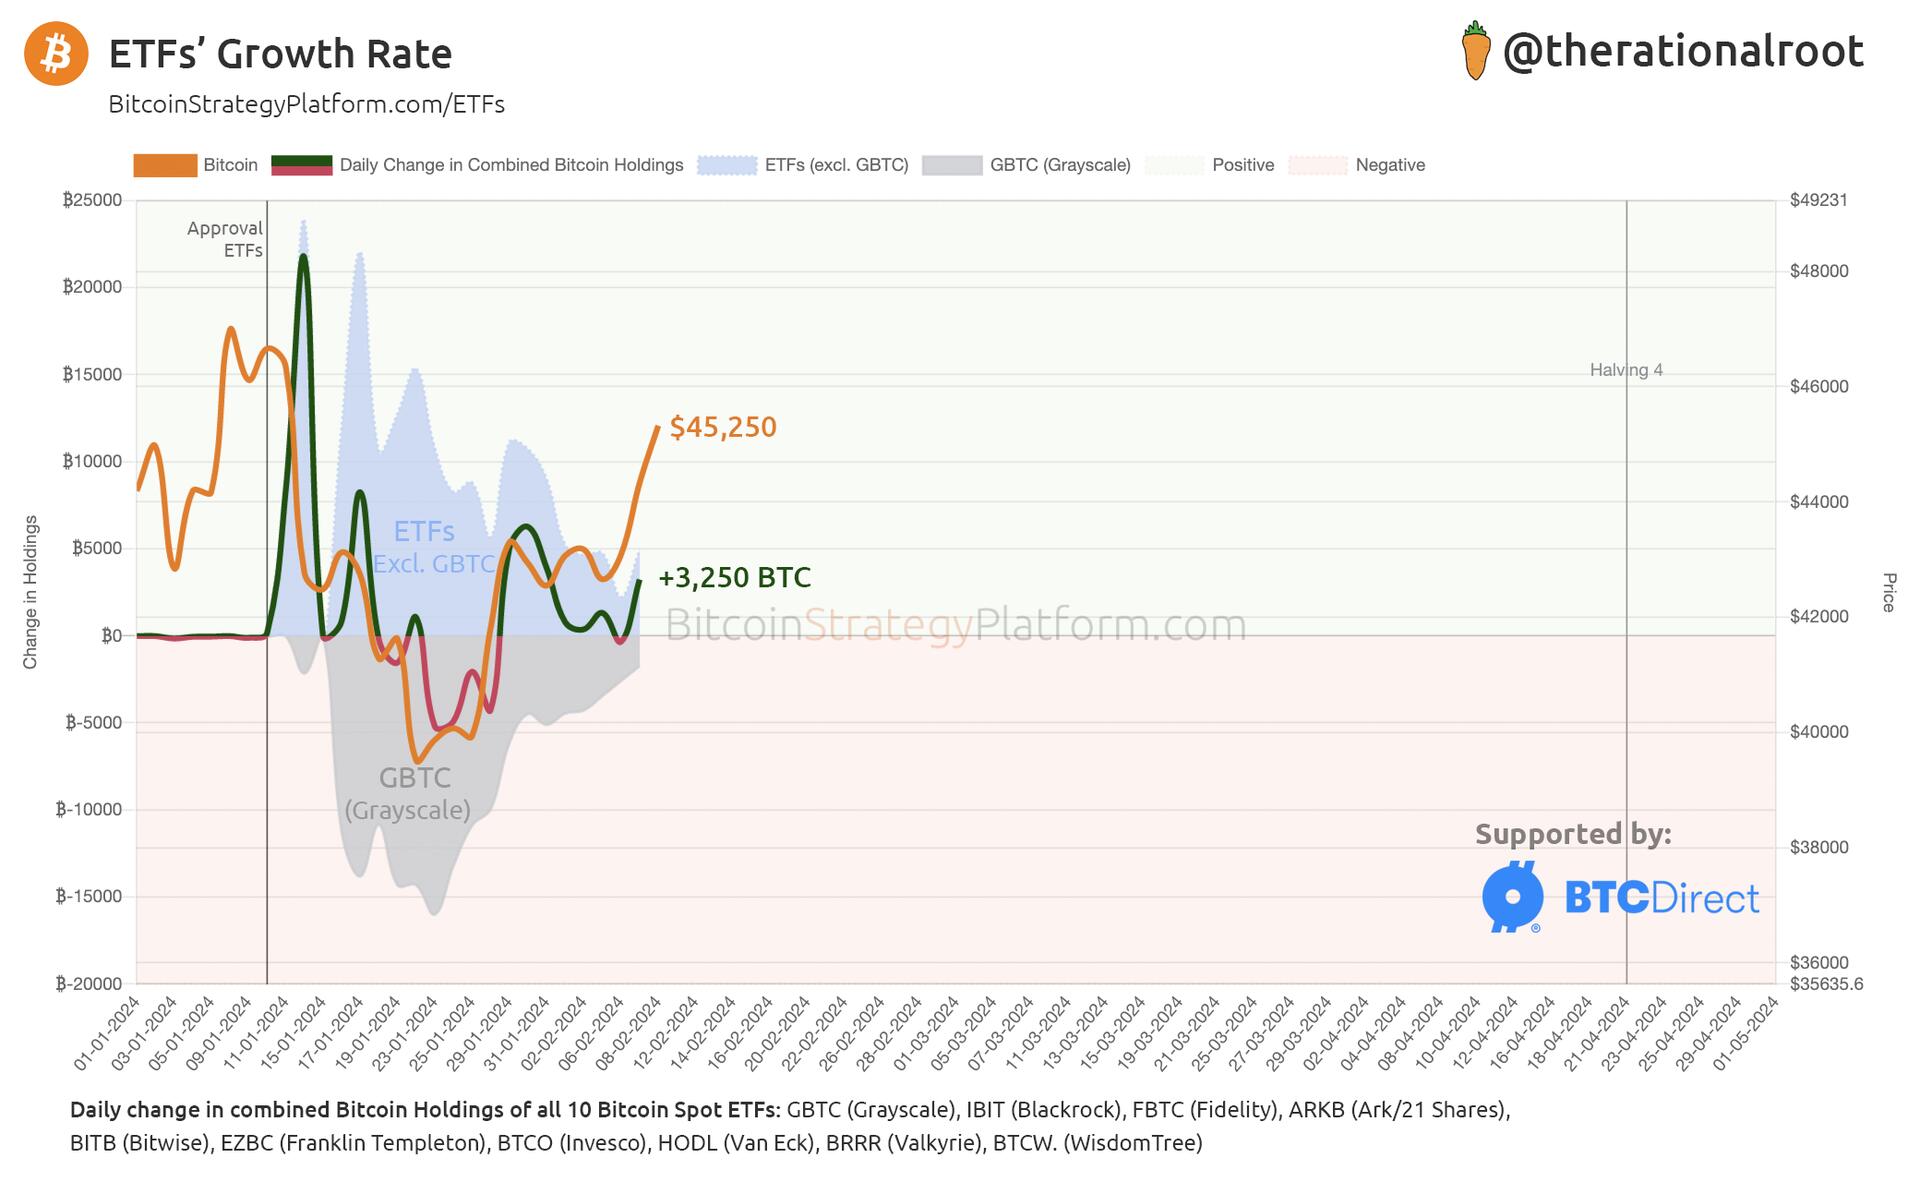
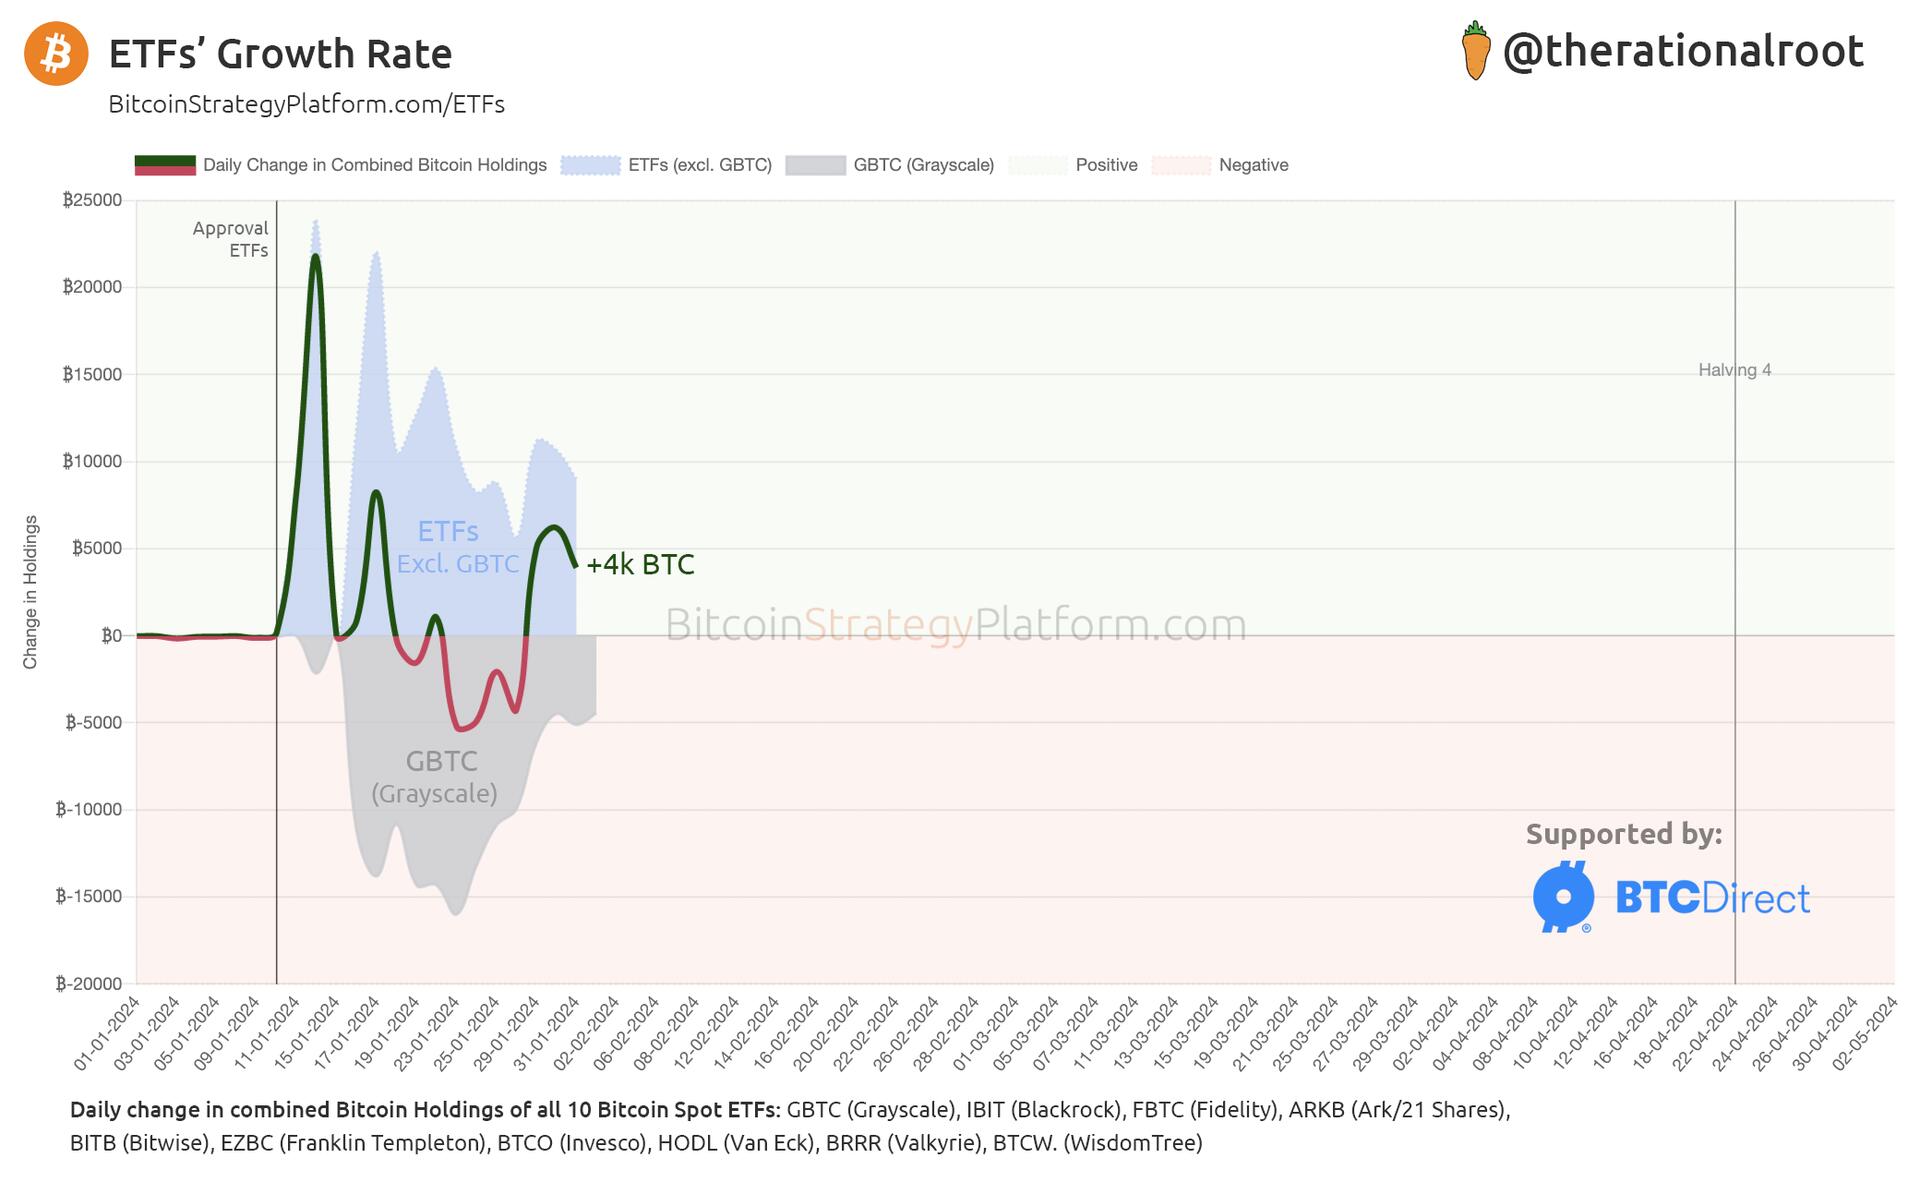
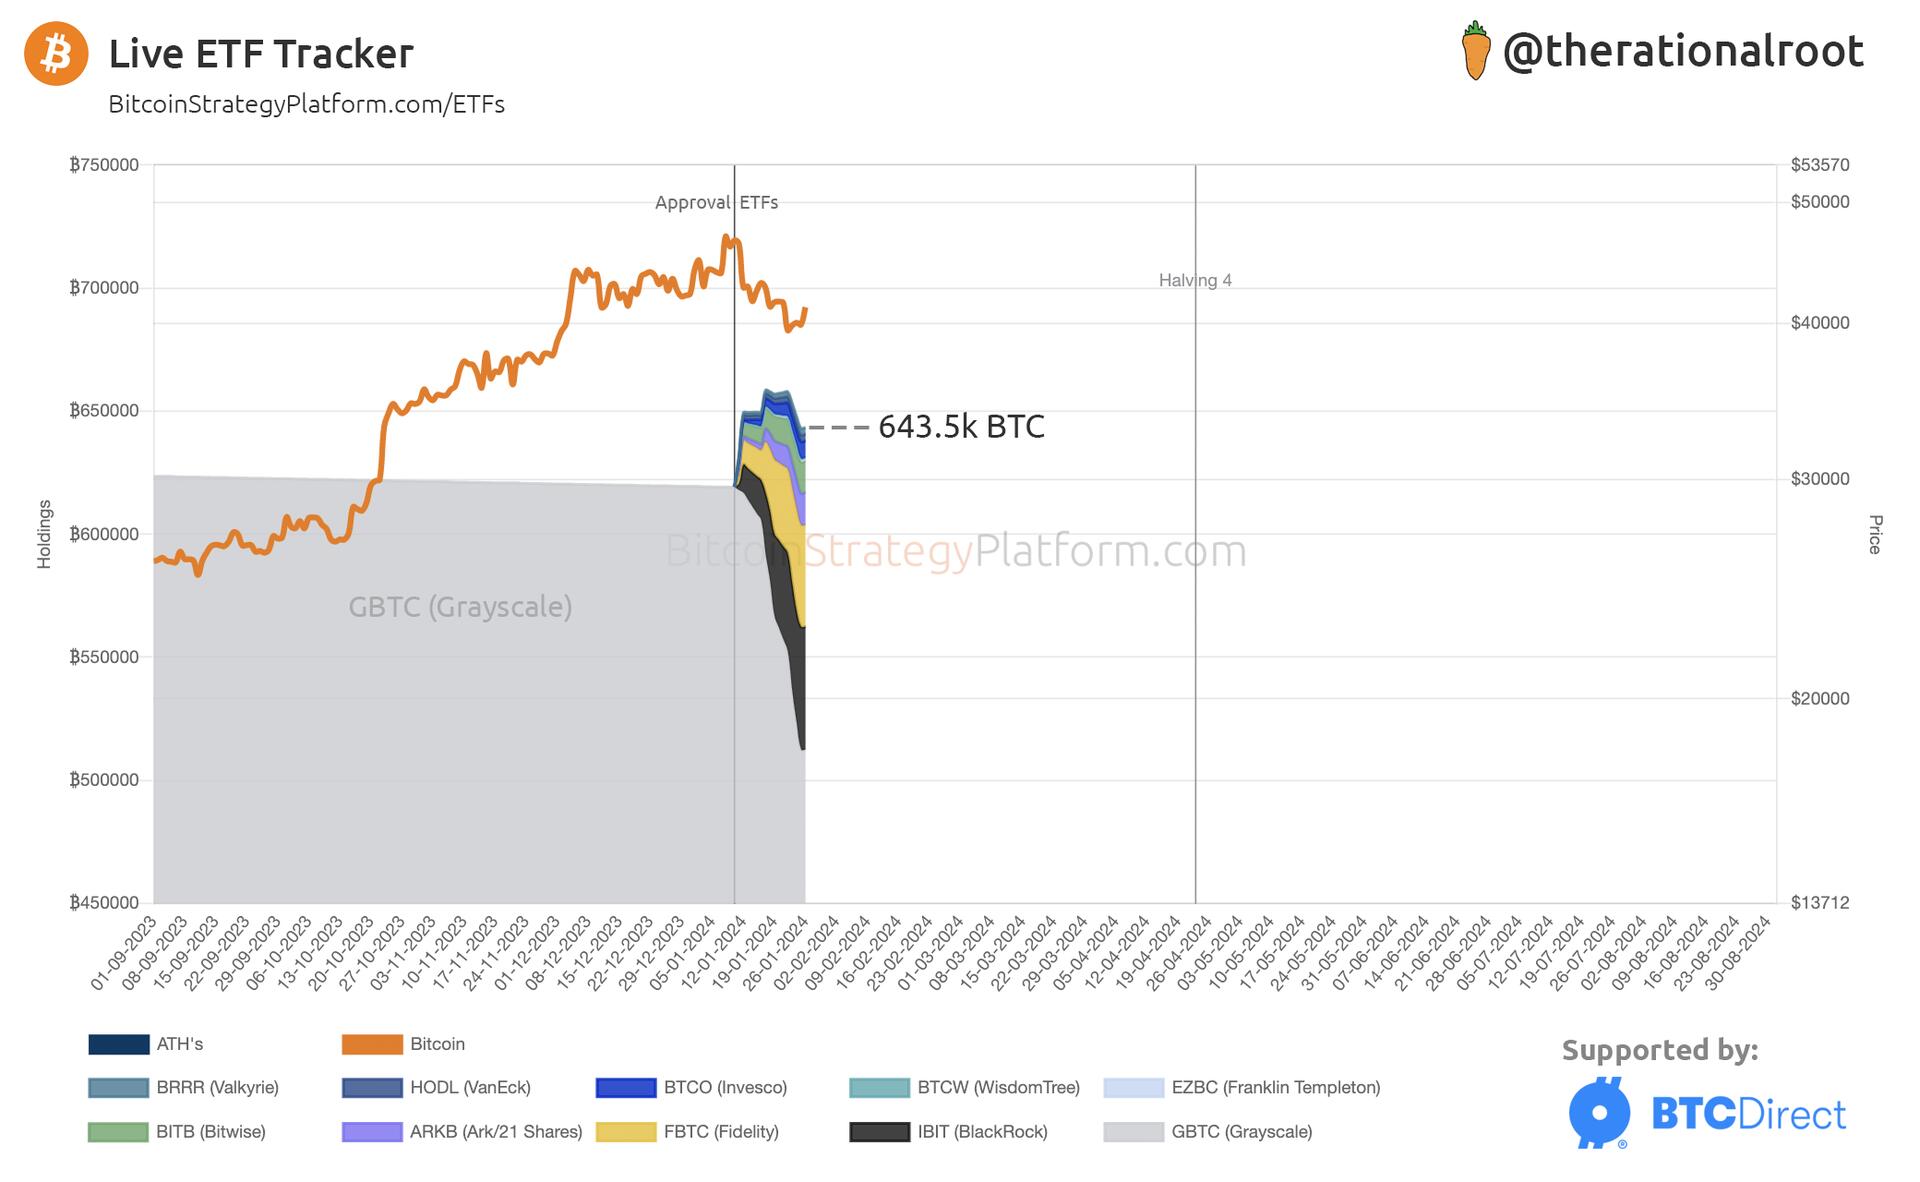
Another massive day for the ETFs: -Fidelity bigger inflows than BlackRock. -Reduced outflows of Grayscale. #Bitcoin image
Latest ETF results: +2.6k BTC added to holdings (half of last Friday) #Bitcoin image
UPDATE: Live ETF Tracker — v2.0 🔥 This week’s data is in: - ETF Net In-Flows consistently over +6K BTC this week - Cumulative holdings at All-Time-High of 726K BTC - Cumulative holdings up 100k BTC since launch - Blackrock alone added over 30k BTC this week - Grayscale down 166k since launch New in ETF tracker v2.0: ✅ Faster availability of data ✅ BTC focused, presenting data that affects the underlying Bitcoin market ✅ Detailed overview + Charts of Holdings + Growth Rate 🥕 Follow the Bitcoin Strategy ETF Tracker for Live Updates, more is coming! 🥕 Check the latest Bitcoin Strategy newsletter below. #Bitcoin image
Enormous ETF inflows, net +12k #BTC were added yesterday. - BlackRock alone saw a 10k btc inflow, and now surpassed 100k btc in holdings 🤯. - Biggest outflows were from Grayscale (1.9k) and Invesco (~500 btc). - Three consecutive days over +10k net inflows. Follow me for more ETF news 👊 image
10k BTC net inflow to ETFs in a single day. #Bitcoin price showing high correlation with ETFs’ flows. Supply already tight, NGU! image
ETFs' net inflow +3,250 BTC. $45,250 #Bitcoin Correlation with ETFs' flows. image
How about the new #Bitcoin Hoodie?! Now available at 👉 21mil.nl @TheRationalRoot 🥕 merch. image
Spot ETFs’ Growth Rate: +4,000 BTC/Day. - Grayscale’s outflows slowing - Other ETFs seeing substantial inflows #Bitcoin 🧵 image
On-chain value map. #Bitcoin 🟢 Green zones highlight 'fair value' periods. Around Bitcoin Halvings (both pre and post), the price often hovers in these green zones. Observe how both the entire bull market phases (marked by blue price dots for ATHs) and bottom formations deviate from the fair value range. The value map is based on the metrics: realized cap, liquid supply and coin days destroyed. image
It's not like we were not overvalued, for good reasons, at more than 0.5 standard deviations from the STH cost basis. The current reset is very healthy. #Bitcoin image
For today's investors, the optimal DCA time frame is 89 days — aimed to minimize risk and maximize profit, based on the current position in the 4-year cycle. Those adopting an 89-day DCA, even at the least opportune moment, were in profit within 3 years! #Bitcoin Disclaimer: historical performance doesn't assure future results. image cc: @preston